The smog Delhi can’t
wish away
Eleven years of data show how Delhi’s air turns bad every winter, on schedule. HT weighs smog towers, mist guns, sweepers and Grap measures against this pollution
Every afternoon at about 4pm, the Central Pollution Control Board (CPCB) publishes a bulletin that gives a number for Delhi’s air quality. This number is the average of the city’s monitors over the previous 24 hours, on a scale of 0 to 500.
Most headlines on the city’s air quality cite this figure, better known as the air quality index, or AQI. It has been published, with few gaps, since May 2015.
On any one day, the AQI changes with the weather, the festivals and the farm fires, among other reasons. Across eleven years, despite a range of measures, policy announcements and action plans, the charts that show how clean Delhi’s air is have barely moved.
The same dark weeks, every winter
Each line is one day of Delhi’s bulletin, coloured by category: 4,145 days from May 1, 2015 to October 14, 2026. The 40 days with no bulletin are blank.
The air was ‘very poor’ or ‘severe’, with an AQI above 300, on 945 of those days. Of this, 814 days were recorded between October and January, the capital’s winter pollution season.
Of the 173 ‘severe’ days (AQI above 400), 170 fell in the same period. The remaining three were recorded in mid-June 2018.
Stacked as years running from July to June, the worst days fall in the same weeks every winter.
The dark block begins in the second half of October, when farmers in states around Delhi, including Punjab and Haryana, burn paddy stubble. This period of smog lasts through December and January, when cold and still air holds pollution close to the ground.
The first half of November is generally the worst fortnight. Its median AQI has been above 340 (very poor) every year since 2015.
The monsoon months, July to September, are the cleanest, with a median AQI of 97, at the top of the ‘satisfactory’ band, as rain washes away pollutants in the air.
Air quality reached ‘good’ – 50 or under – on just 14 of the 4,145 days. Ten of them, ringed, were recorded during monsoon.
In mid-June 2018, far beyond the usual pollution season, the AQI bulletin logged three consecutive ‘severe’ days as dust storms from Rajasthan and the northwest swept into the city.
During the national lockdown as the Covid-19 pandemic reached India, from March 25 to May 31, 2020, the median AQI for Delhi was about 120. Pollution-causing emissions saw a drastic fall in that period as most vehicular traffic and commercial activities, including industries, came to a grinding halt.
For 25 days in this timeframe, the city’s AQI was 100 or lower. In the same weeks of every other year since 2016, there were no more than six.
One number, many monitors
Delhi’s AQI is an average of readings from monitoring stations across the city. There were five stations in 2015 and 2016, more than 30 by 2019, and there are 59 this year. The readings of the early years therefore may capture only a slice of the city’s air pollution, and comparing them with recent years may be misleading.
This is why year-by-year comparisons in this analysis start from July 2018.
The AQI also stops at 500. On the most polluted days, the logged AQI cannot show how much higher pollution levels were.
The charts that follow look at Diwali, at each year since 2018, and at other cities.
Worse at Diwali, no better over the years
Each row is one year, lined up so that Diwali falls in the same column.
The AQI published the day after Diwali is the one that captures the festival night, because each bulletin covers the 24 hours up to 4pm. In every year from 2015 to 2025, that reading was higher than the reading for the day before Diwali. The median increase was 55 points. On other days in the weeks around Diwali, the AQI rose over a two-day stretch only about half the time, and by a median of 6 points.
Sorted from cleanest to worst day, each year’s bar shows how many days fell in each category.
Days above AQI 300, ‘very poor’ or ‘severe’, have numbered between 64 and 94 a year since July 2018. Severe days, above AQI 400, between 8 and 21.
The days above 300, Very Poor or Severe. Since July 2018 there have been between 64 and 94 a year. Severe days, above 400, have numbered between 8 and 21.
Patna, Lucknow and Kanpur, further down the Gangetic plain, show the same dark band of ‘very poor’ and ‘severe’ days every winter that Delhi does. Kolkata, at the eastern end of the plain, has one too, but it is shorter, with fewer ‘very poor’ and ‘severe’ days.
Mumbai, Hyderabad, Chennai and Bengaluru show almost none.
From July 2018 to June 2026, Delhi’s AQI was 100 or under on 19% of the days. Patna’s was 32%, Kolkata’s 58% and Bengaluru’s 83%.
Delhi’s median day read 188. Bengaluru’s was 69.
Delhi’s bulletin, year by year, as a table
| July to June | Days | Median | 100 or under | Above 300 | Above 400 | Highest |
|---|---|---|---|---|---|---|
| 2015–16 | 356 | 256.5 | 19 | 115 | 14 | 435 |
| 2016–17 | 357 | 237 | 26 | 100 | 19 | 497 |
| 2017–18 | 364 | 218 | 50 | 95 | 15 | 486 |
| 2018–19 | 365 | 209 | 51 | 91 | 21 | 450 |
| 2019–20 | 366 | 148.5 | 94 | 64 | 19 | 494 |
| 2020–21 | 365 | 199 | 75 | 86 | 19 | 477 |
| 2021–22 | 365 | 211 | 69 | 71 | 19 | 471 |
| 2022–23 | 365 | 173 | 77 | 74 | 8 | 450 |
| 2023–24 | 366 | 192.5 | 47 | 94 | 15 | 468 |
| 2024–25 | 364 | 179.5 | 77 | 68 | 14 | 494 |
| 2025–26 | 364 | 176 | 76 | 80 | 10 | 461 |
Median daily monitors reporting: about 5 in 2015–16, 9 in 2017, 28 in 2018, 33–37 in 2019–2025, 43 in 2026.
What the data doesn’t show
Why the winters are bad: The AQI measures how polluted the air was. Saying where the pollution came from takes source studies. The winter smog season runs across the stubble-burning weeks, the coldest and stillest weather of the year and several festivals. A daily figure to indicate pollution level cannot separate them.
The Diwali impact: The increase in pollution just after Diwali recurs every year and the spike is far more than the usual two-day change in those weeks. That indicates the cause as emissions from firecrackers, but the AQI bulletin cannot split any year’s increase between pollutants added by fireworks and that week’s weather.
Whether air quality is improving: Days at AQI 100 or lower have been more common since July 2018 than before. But the early years rest on far fewer monitors, and since 2018, the yearly counts rise and fall with no steady direction.
How fair the city comparison is: Each city’s AQI averages its monitors, and the networks differ in size and placement. The air residents breathe also depends on where they live and work.
The fixes Delhi reaches for every winter
Smog towers and guns
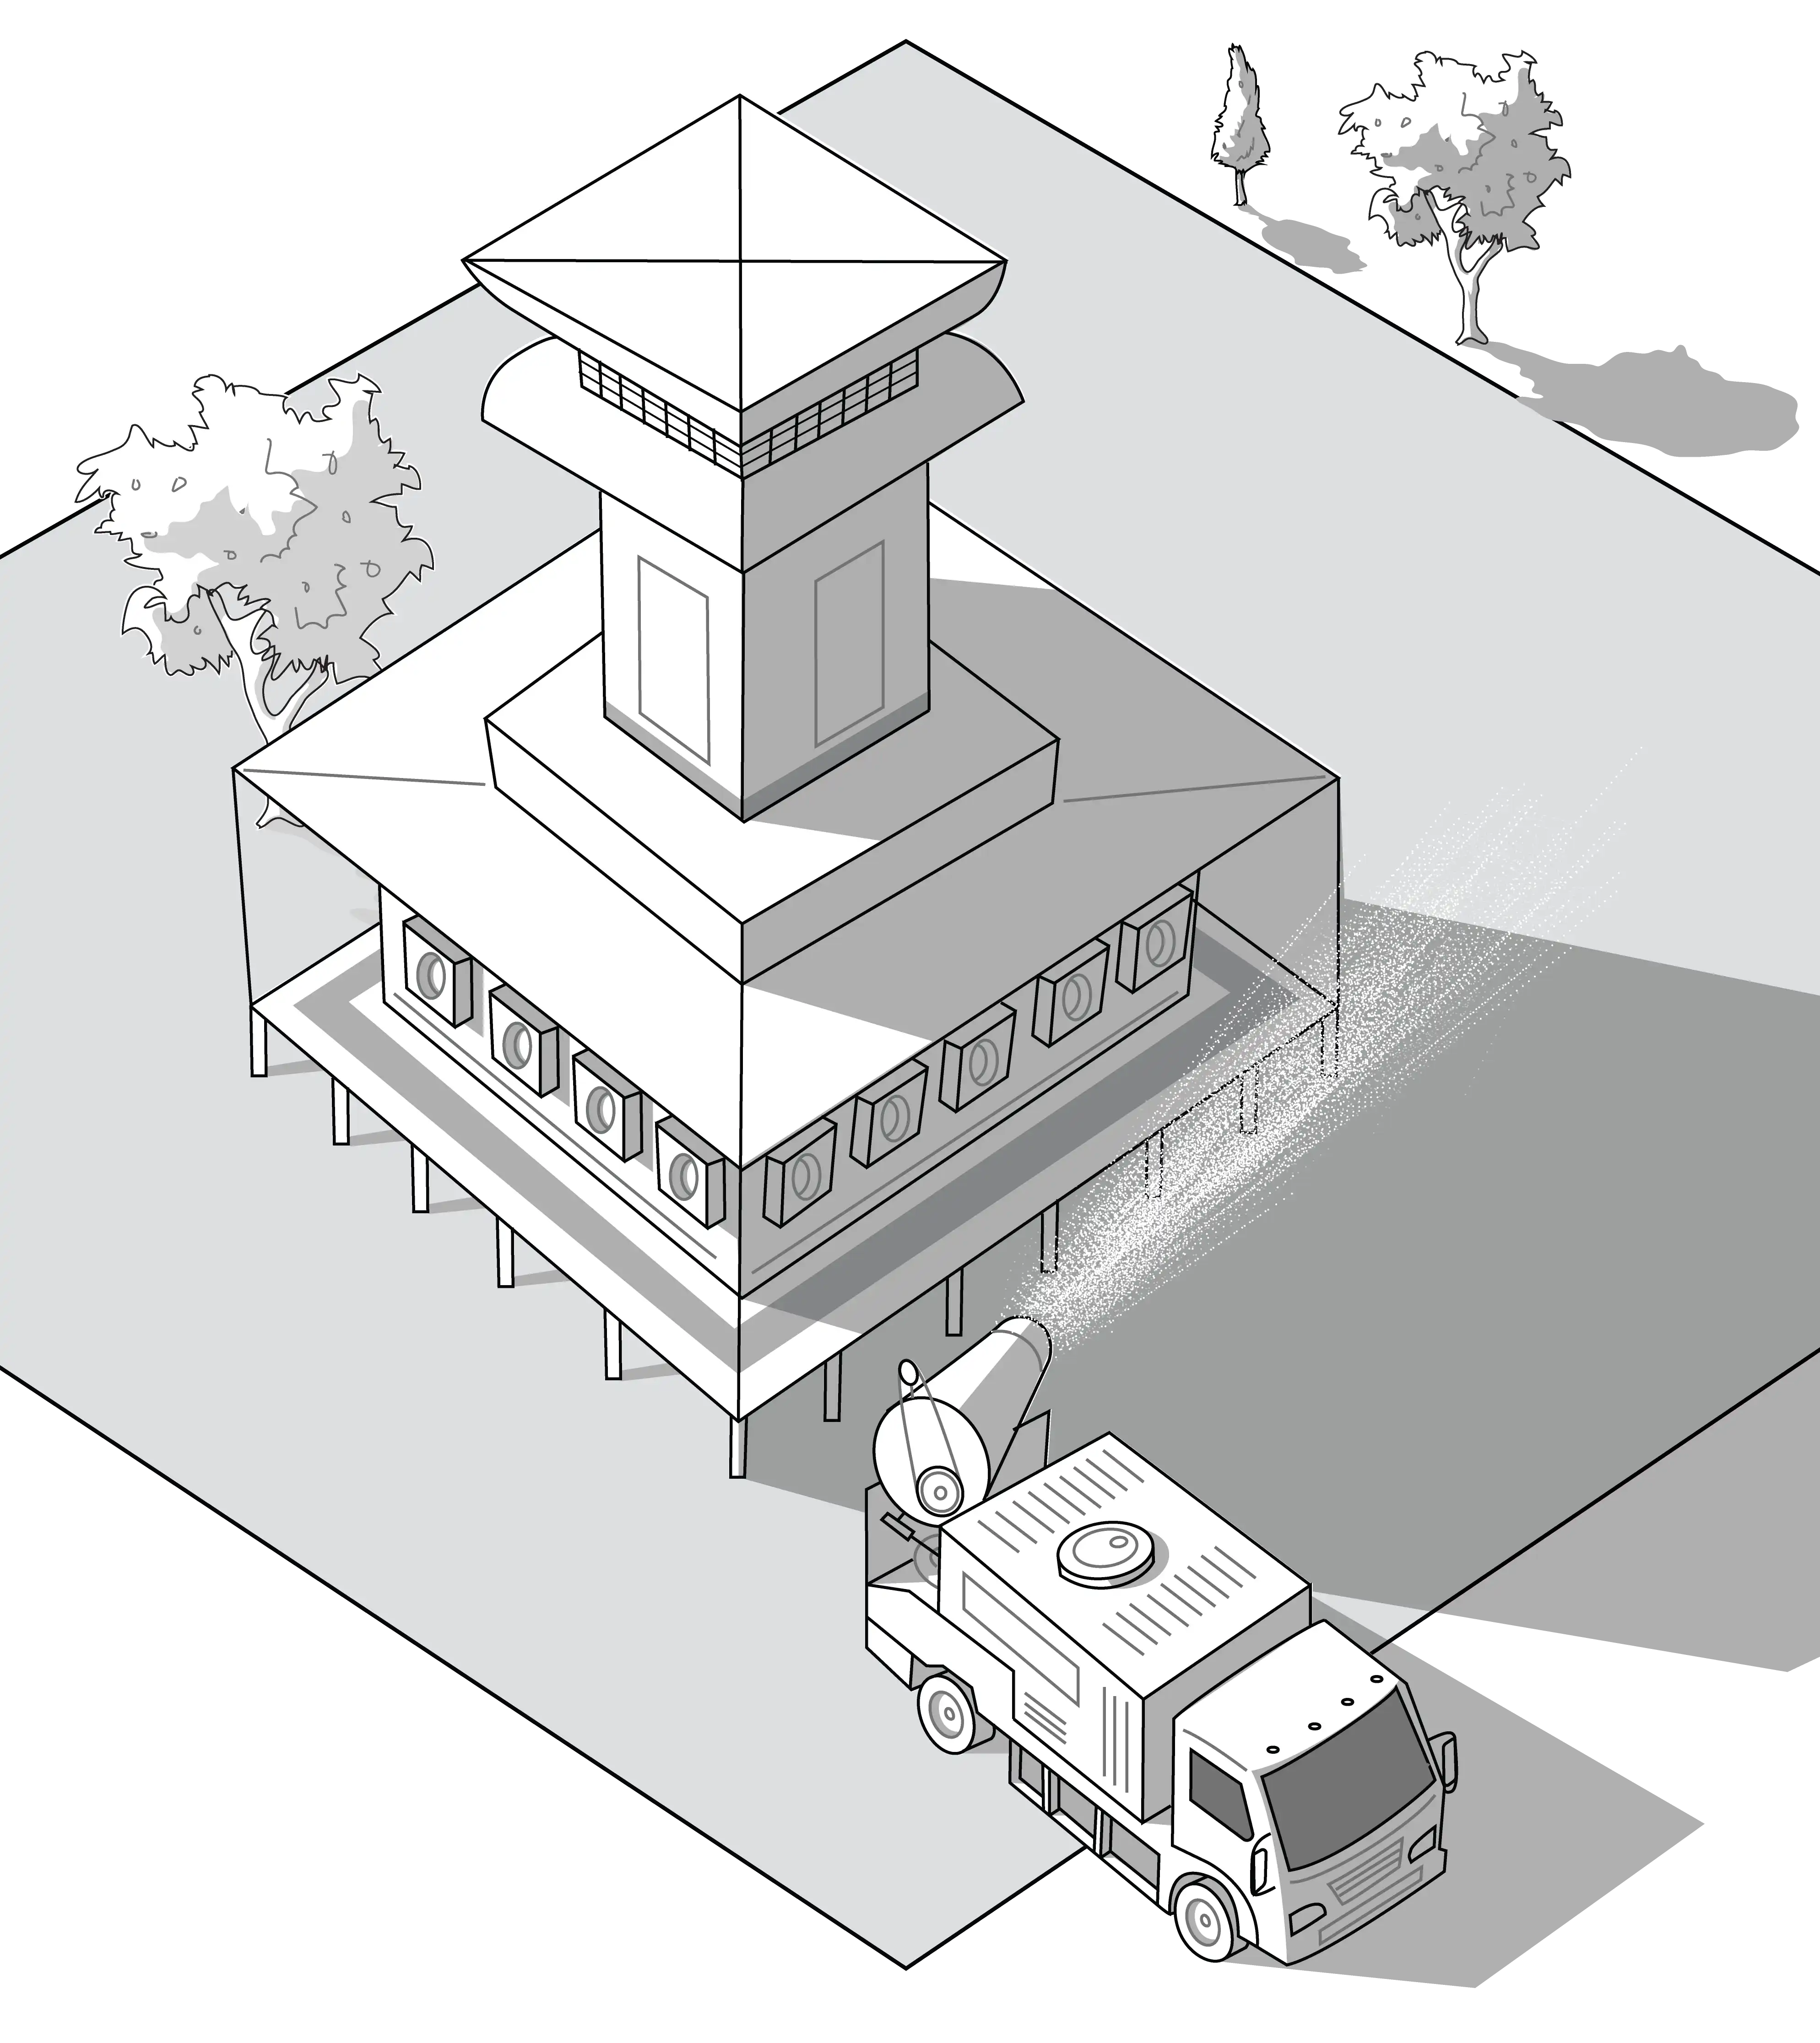
Delhi’s two smog towers, at Connaught Place and Anand Vihar, opened in 2021 at about ₹19 crore each. The Connaught Place tower pushed about 1,000 cubic metres of air a second through its filters, roughly one part in 43,000 of the air crossing Delhi each second on a typical January afternoon.
IIT monitoring cited by the Delhi Pollution Control Committee found particle levels about 50% lower 20 metres from the CP tower, and 12–15% lower at 100–200 metres. Covering the city, it told the National Green Tribunal in 2023, would take 47,229 towers.
The CP tower has been shut since late 2023, and CPCB said in November 2025 that the Anand Vihar one is operational.
Anti-smog guns spray droplets that catch coarse dust well but miss most of the fine particles in Delhi’s winter air. No Indian field study has measured what they do.
Road sweepers
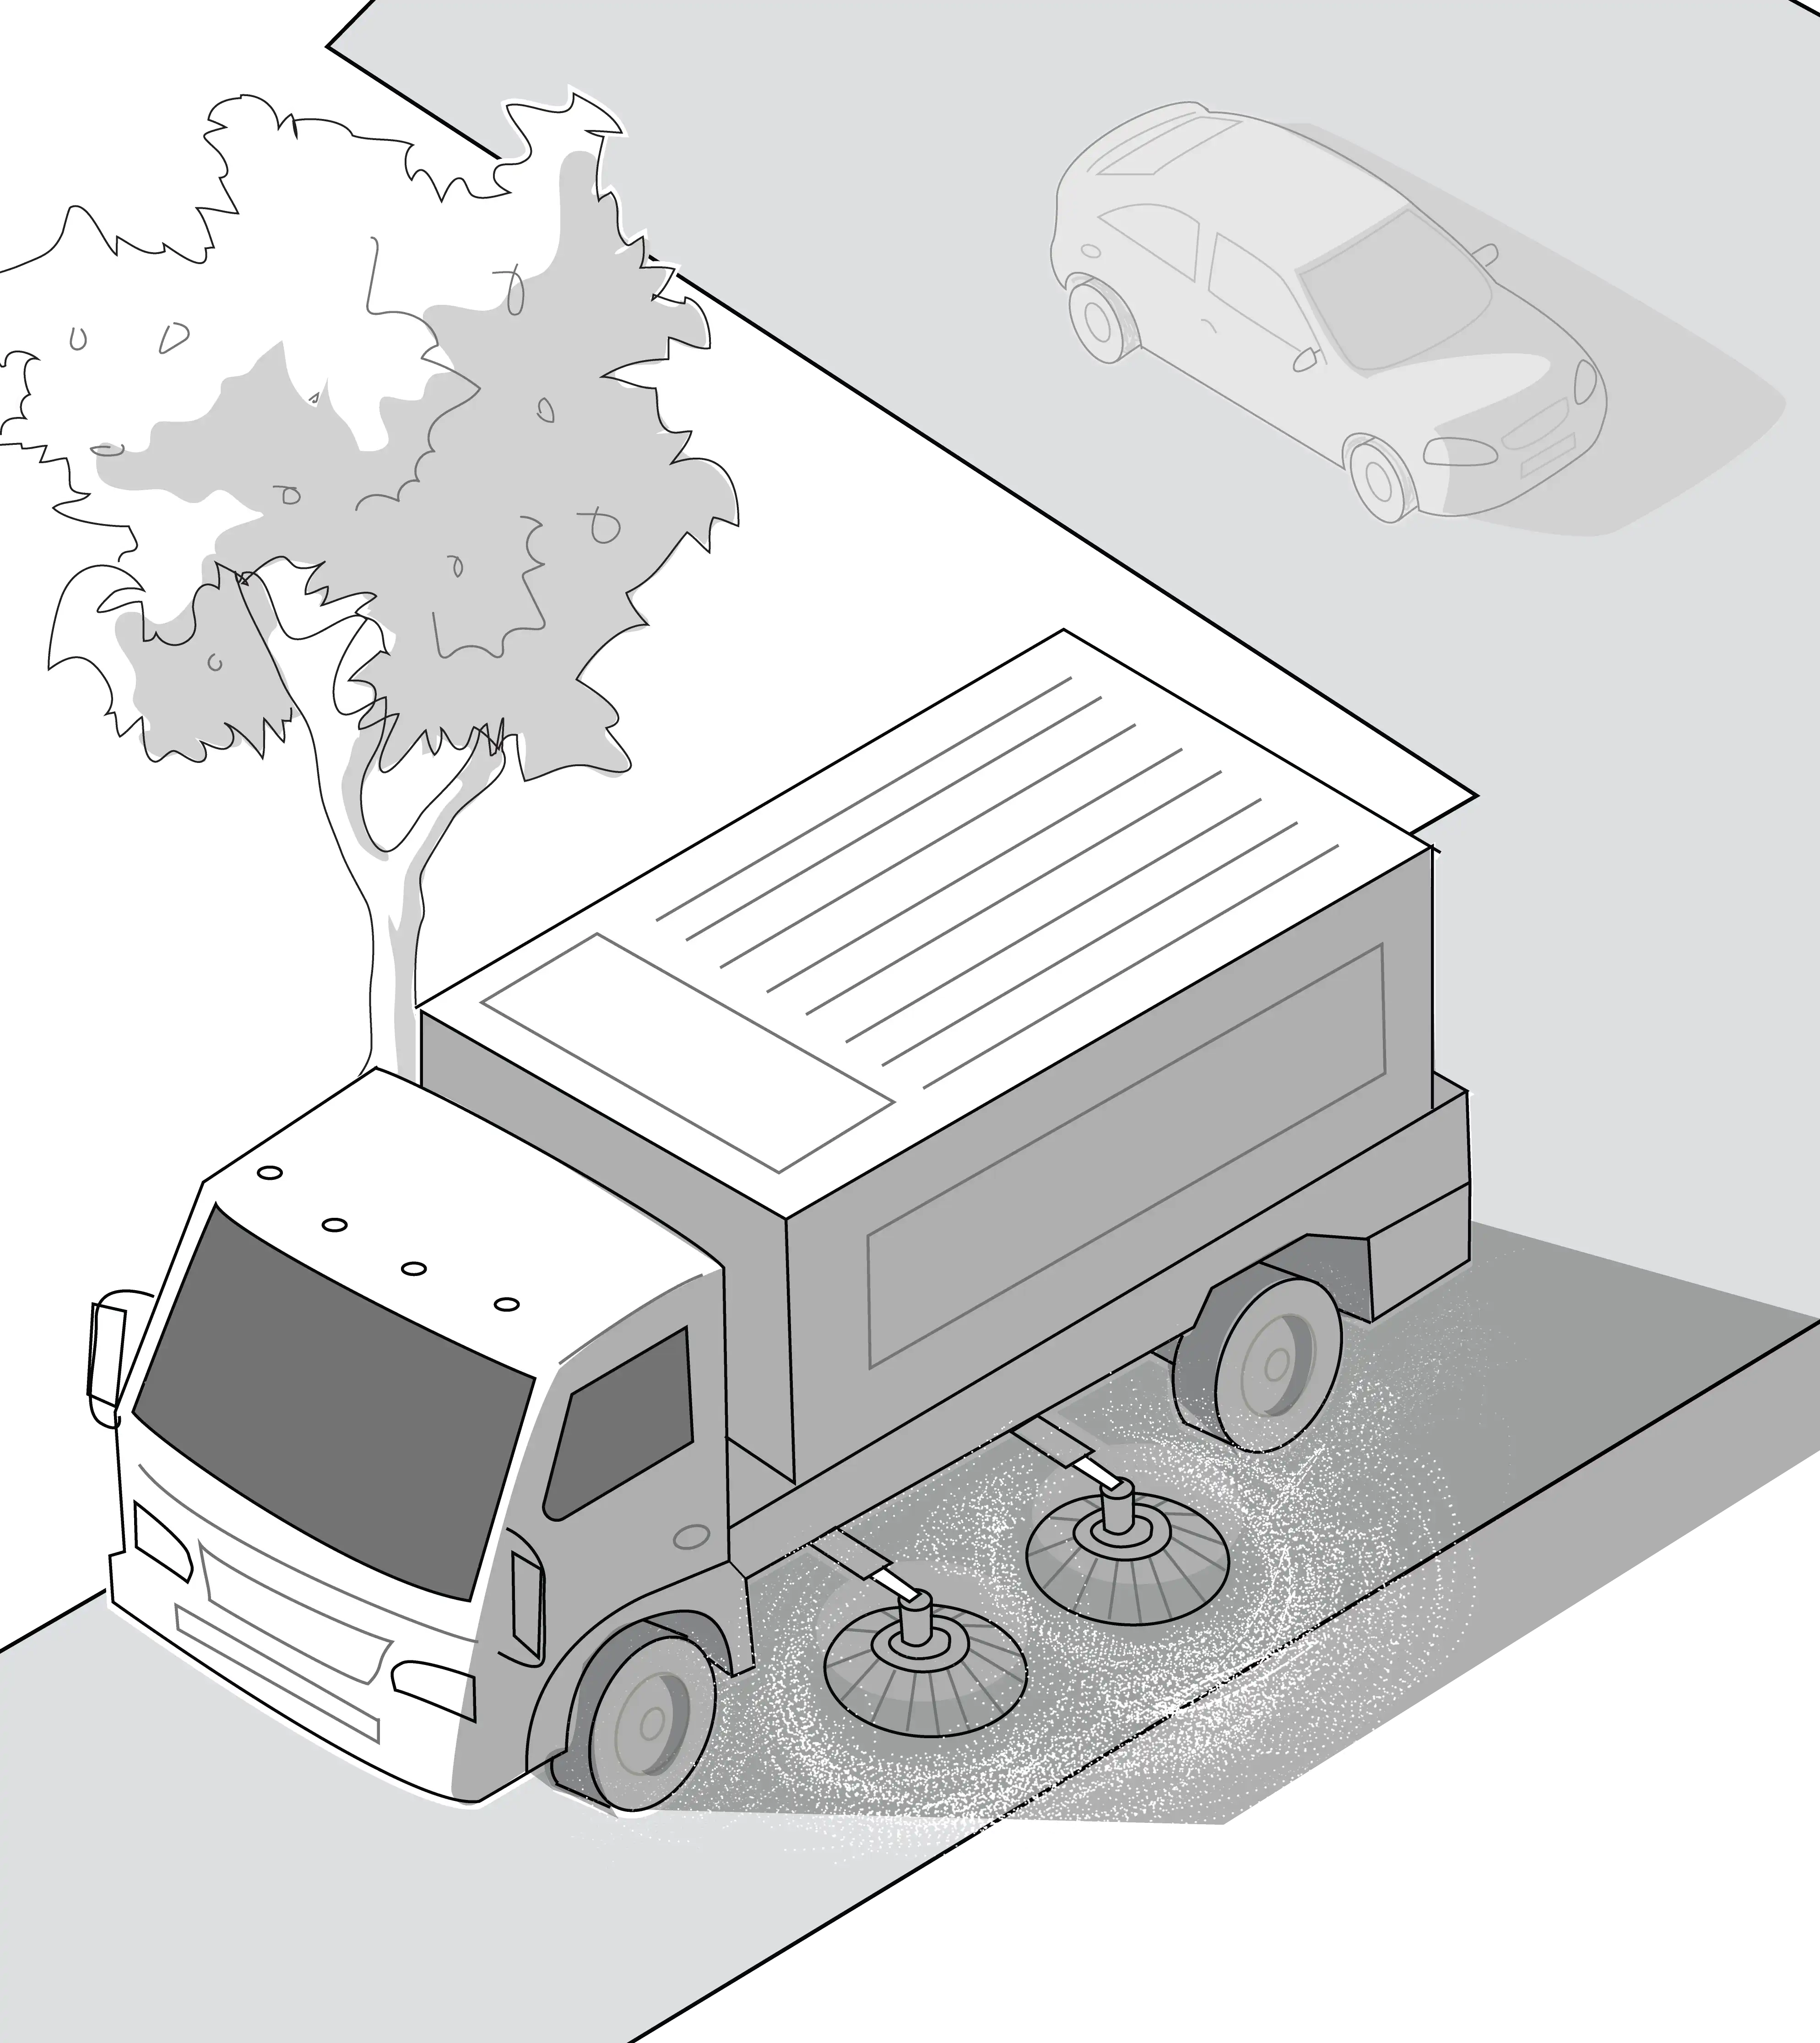
Vacuum sweepers lift the dust that settles along road edges before traffic stirs it back into the air. About 52 machines sweep roughly 1,200 km of Delhi’s roads wider than 60 feet. The Council on Energy, Environment and Water (CEEW) estimates that 161 are needed for full coverage.
No study has measured what Delhi’s sweepers do to mitigate pollution. In Barcelona, intensive street cleaning cut coarse particles (PM10) at the kerb by about 6%, and only in the afternoons.
Broken road edges and poorly kept machines also limit what the sweepers can pick up. And road dust made up about 4% of the fine particles (PM2.5) in Delhi’s winter air in a 2018 study of pollution sources, though others put it far higher.
Misting poles and sprinklers
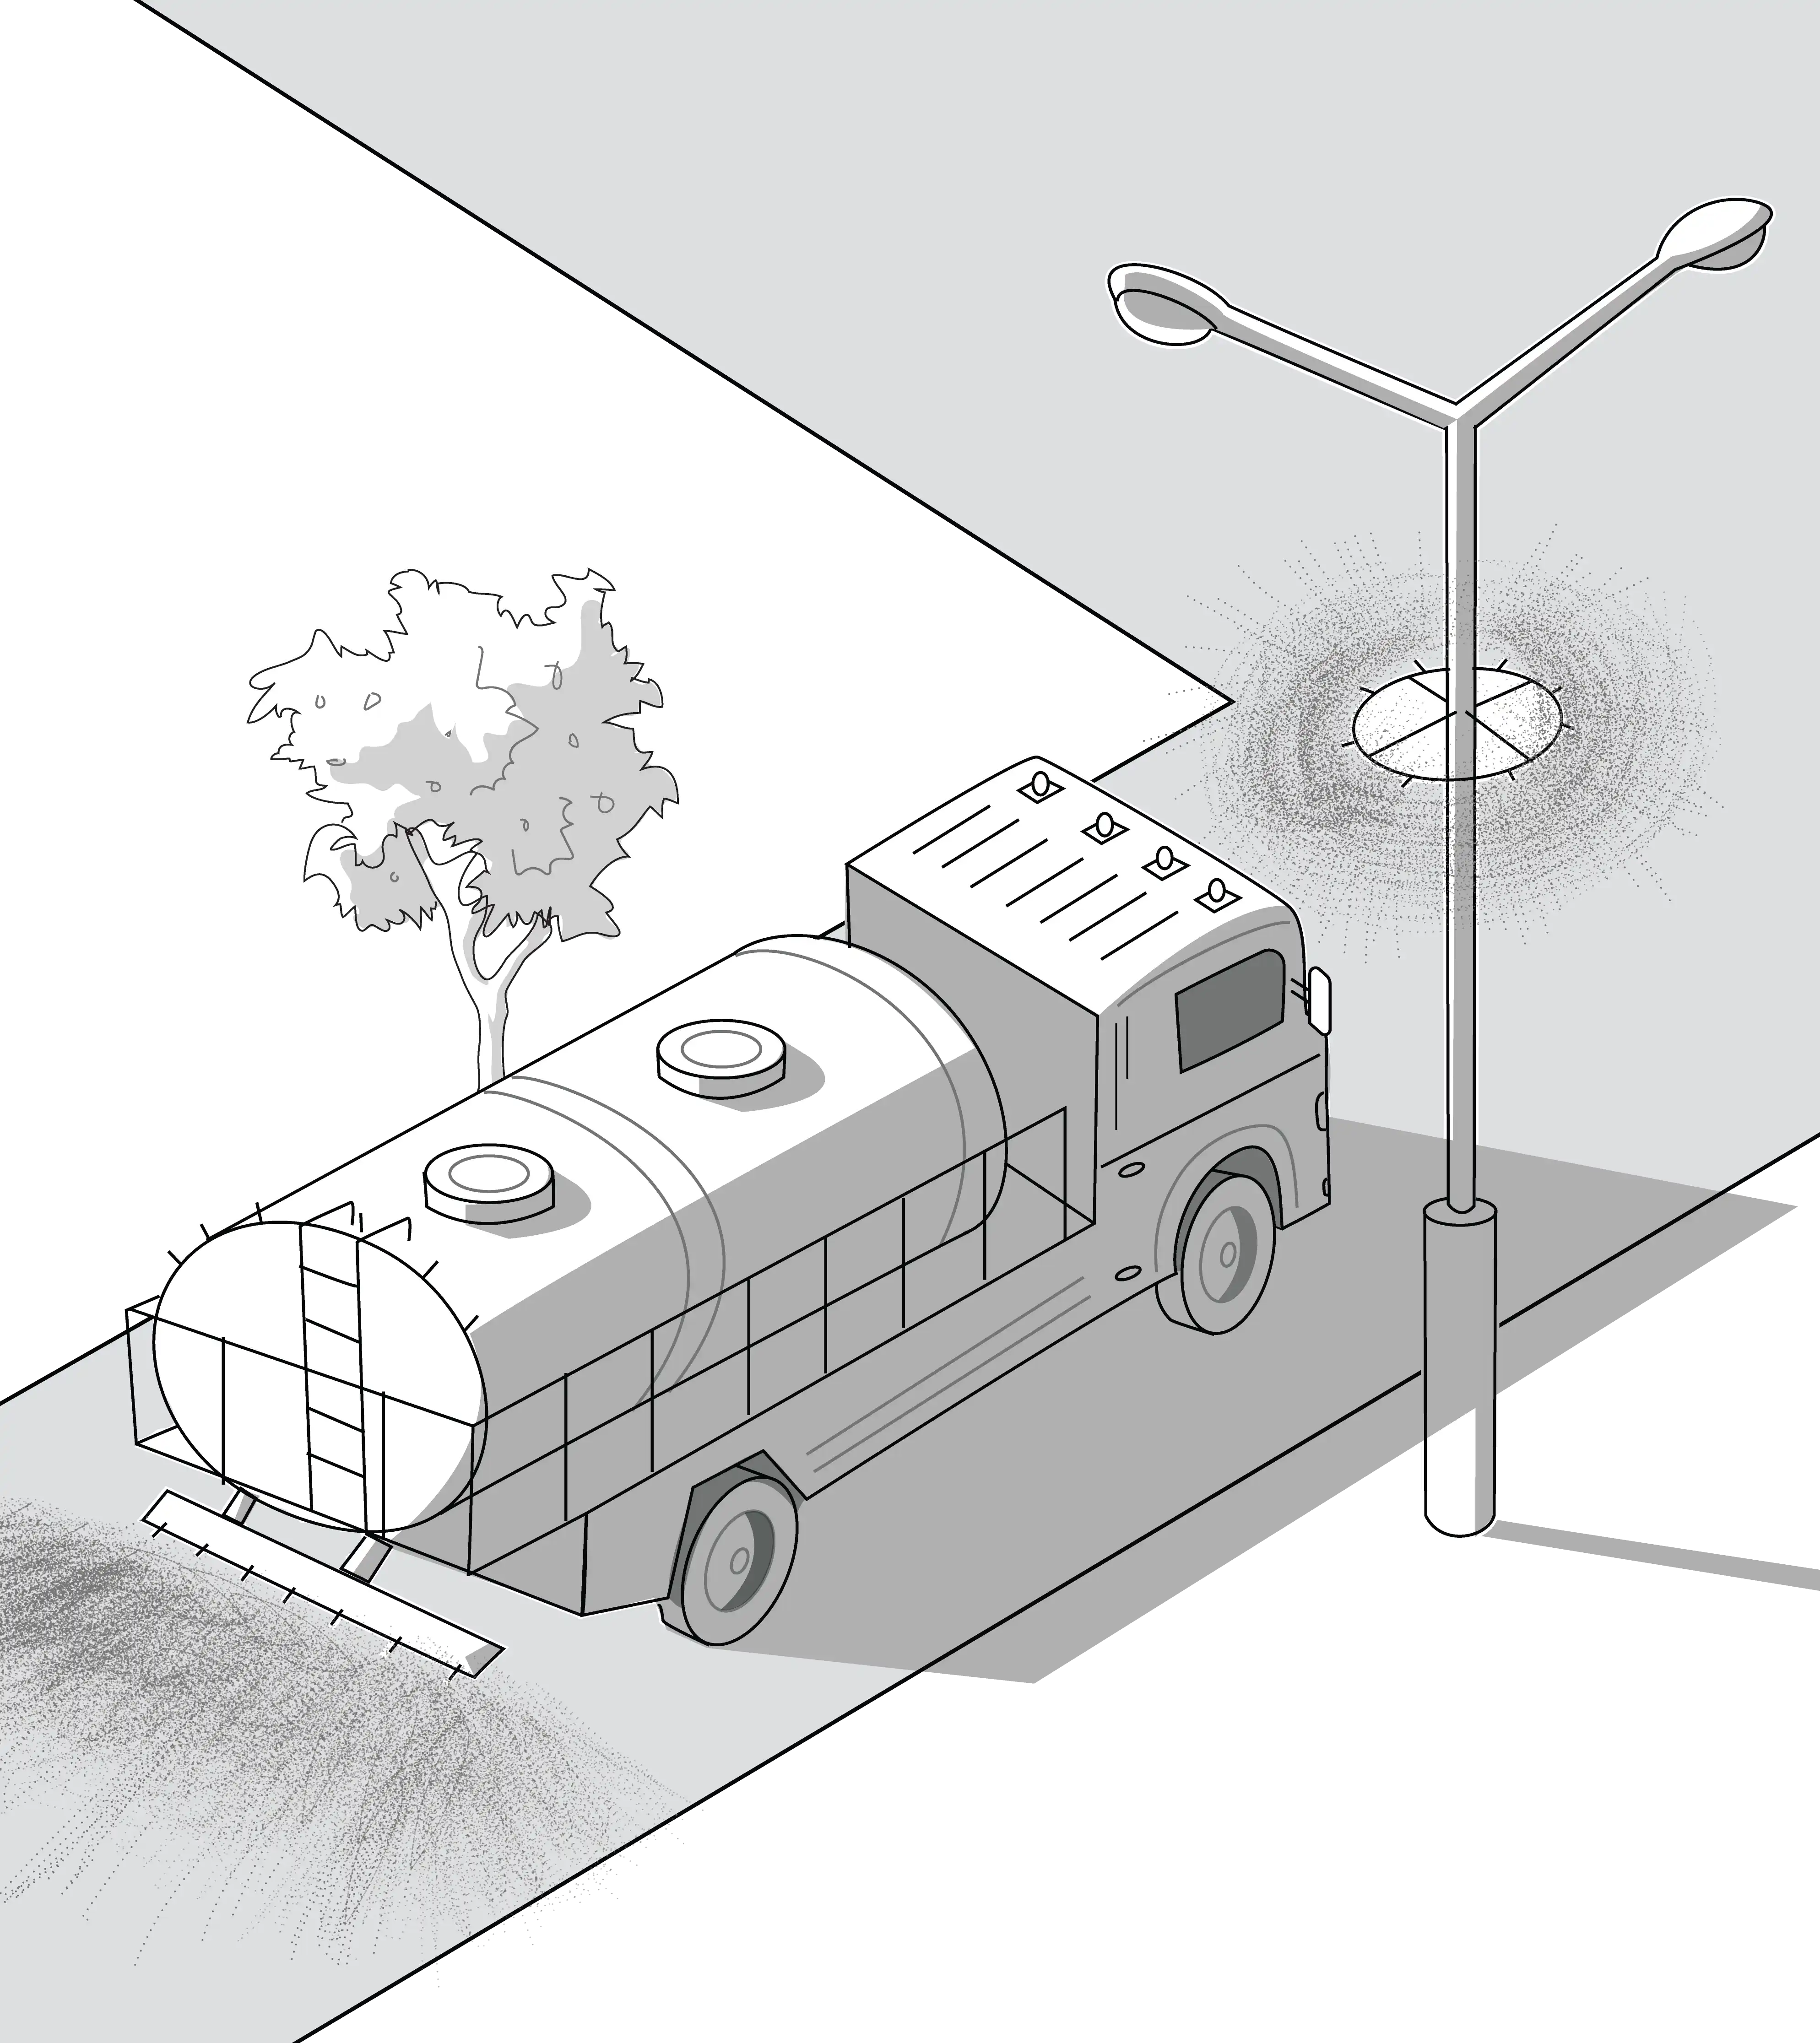
Misting poles spray fine water over the road from nozzles on streetlights. There are dozens of these poles at ITO, and some on Lodhi Road and Shanti Path, along with mist sprayers in Narela, Bawana and Jahangirpuri, and the Delhi airport. There are no known before-and-after readings for such installations.
The mist, some studies suggest, may even add fine particles. In Nanchang, China, mist-cannon trucks raised roadside PM2.5 by up to 13% within about half-an-hour, as the moisture helped new particles form, even while road dust fell.
Sprinkler tankers spray water on roads, so traffic cannot lift settled dust. A 2018 study for the Central Pollution Control Board (CPCB) found that spraying water cuts road dust by about 25–30%, and that the water dries within 10–15 minutes. With road dust at about 4% of Delhi’s winter PM2.5, that is the most that spraying water on roads could remove.
Grap stages
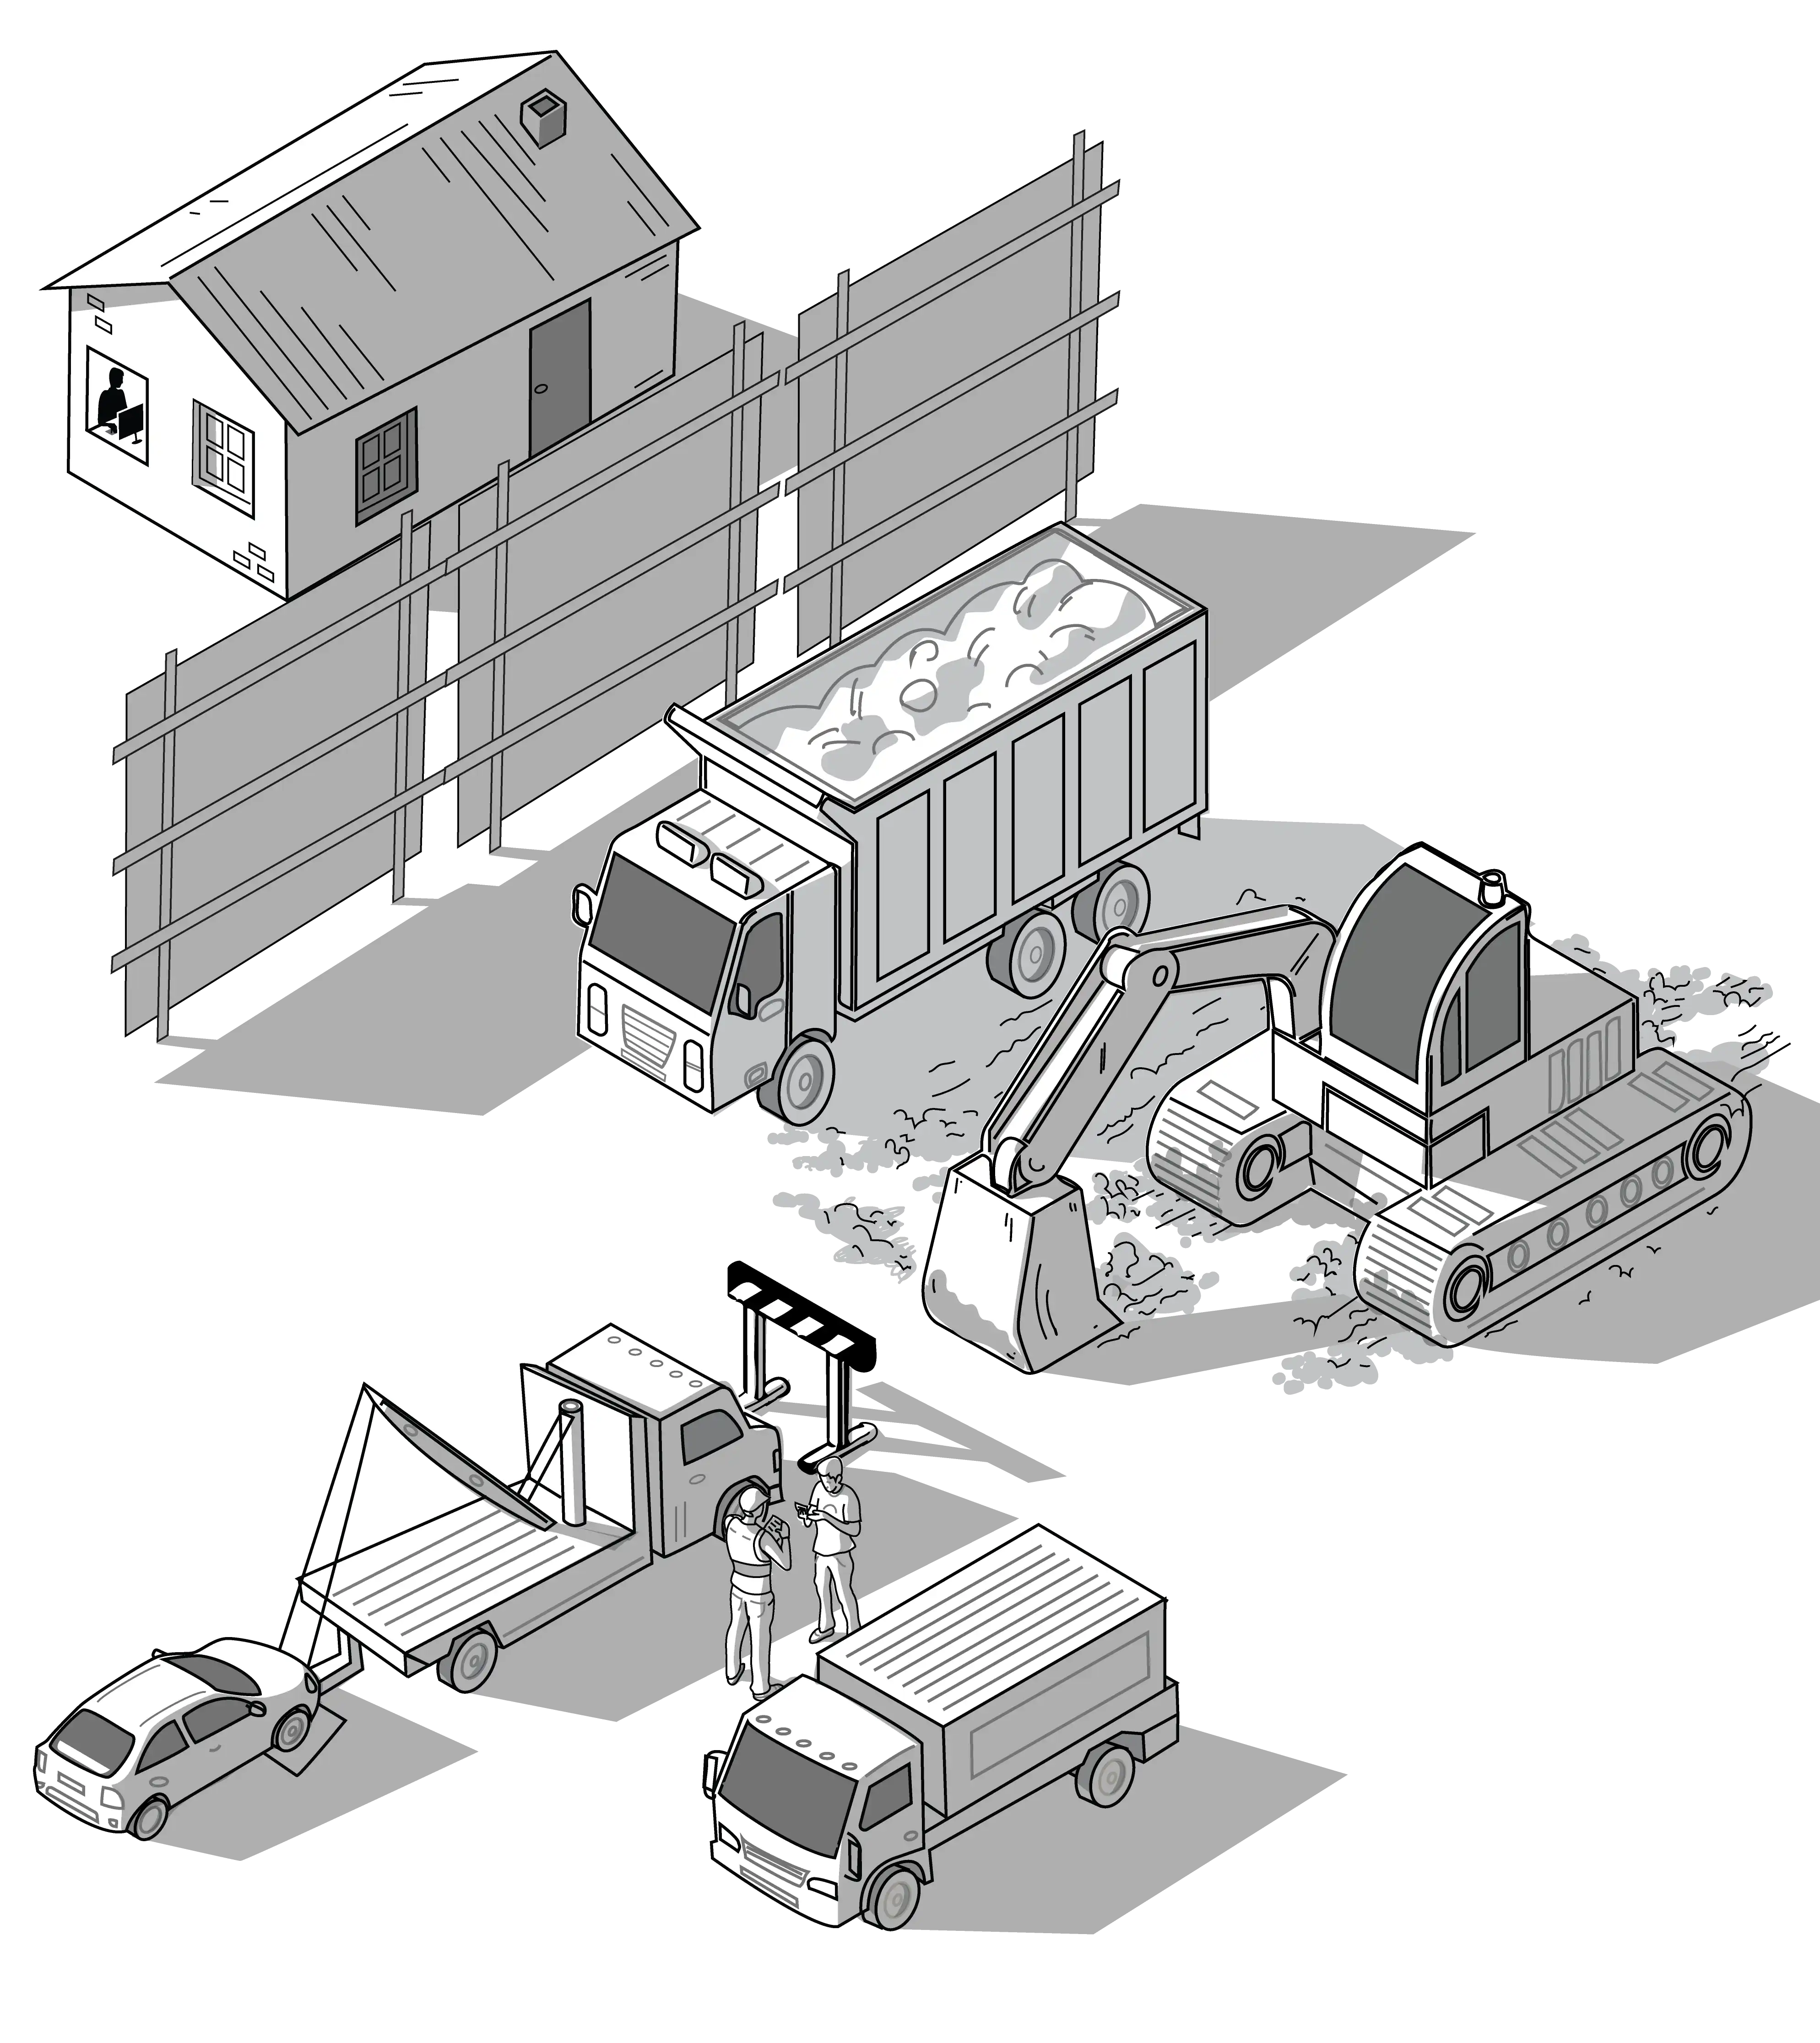
The Graded Response Action Plan, or Grap, adds restrictions in four stages as Delhi’s forecast AQI passes 200, 300, 400 and 450. At Stage III, older petrol and diesel cars are taken off the road, along with older diesel goods vehicles from outside Delhi, and offices may be asked to run at half strength. At Stage IV, only CNG, LNG, electric and BS-VI diesel trucks may enter Delhi, and construction largely stops.
Grap’s effect is hard to separate from the weather’s. November 2024 had Delhi’s highest November PM2.5 average in eight years, according to the Centre for Research on Energy and Clean Air.
In that month’s Stage IV truck ban, the Supreme Court was informed that almost 100 of Delhi’s 113 entry points were unmanned. To this, the bench said, “So far as compliance is concerned, we are not satisfied.”
What it adds up to
Delhi has tried larger steps too. Odd-even car rationing in January 2016 cut PM2.5 by 4-6% in one study and 13% in another, but did nothing measurable that April. Cloud-seeding flights in October 2025 were not effective, and have little scientific backing. Green crackers, allowed for Diwali 2025 and this year as well, did not stop the usual increase in pollution. AQI went from 296 to 351 last year.
This year, from November 1, Delhi has been turning back vehicles registered outside the city that do not meet BS-VI emission standards, along with any vehicle without a valid Pollution Under Control certificate. The curbs run until January 31.
Through all the years, days above AQI 300 have not fallen in any steady way. In spring 2020, when the lockdown halted traffic and industries across the region, Delhi saw 25 days of AQI at 100 or lower. Other years had no more than six in those weeks. The air cleared only when emissions fell across the whole region at once. A lasting fix, it appears, would need cuts as drastic, through the year.
HT Newsroom’s Pollution Dashboard is live — click to know air quality readings at monitors nearest to you, updated for Delhi-NCR every hour.
Sources: Data is from CPCB's daily AQI buletins, pulled by HT's Pollution Dashboard, from May 1, 2015 to October 14, 2026; CAQM revised GRAP schedule (28 September 2026) and stage orders; Delhi government Winter Action Plan; Supreme Court order of 17 December 2025
AI Declaration: Claude Code was used to generate the charts