
Tracking the settlements
More than 45,000 vehicles rolled into Dehradun between May 17 and 18 as soaring heat across northern India sparked a weekend rush of tourists to the hill town and its neighbouring destinations.
A large number of these vehicles were headed to Mussoorie, about an hour and a half uphill from Dehradun.
Tourism, hospitality and the consequent spurt in real estate have strained Mussoorie, a fragile hillside town now marked by construction.
On April 1, the Uttarakhand high court directed authorities to stop felling trees in the Hussain Gunj area of Mussoorie without valid permission. This followed a petition alleging that the Mussoorie civic body had felled trees without permission from the forest department.
The petition reflects the long-term damage to natural vegetation in India's hills.
An HT analysis of satellite data suggests Mussoorie has seen growth in settlements at the cost of natural vegetation over time, which may affect the long-term sustainability of the hill town.
Since municipal boundaries were not readily available, HT used the Mussoorie assembly constituency (AC) boundary for this analysis.
This AC extends to the outskirts of Dehradun, where settlements have increased much more. But the parts of the assembly constituency within Mussoorie’s municipal boundaries are not untouched by settlement growth either.
Satellite data show that the area under vegetation has decreased in the Mussoorie AC, while the area under settlements has increased. The area under settlements has increased from 1.4 square kilometres in 1985 to 8.3 square kilometres in 2022.
The area under forests has decreased from 206.7 square kilometres in 1985 to 198.3 square kilometres in 2022.
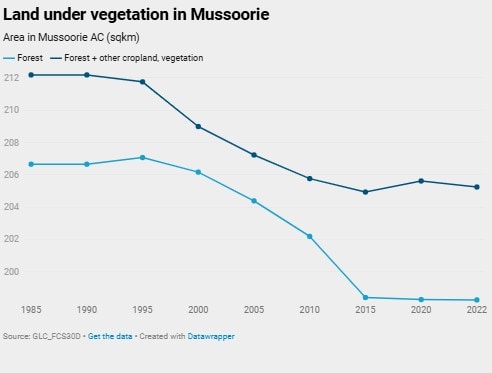
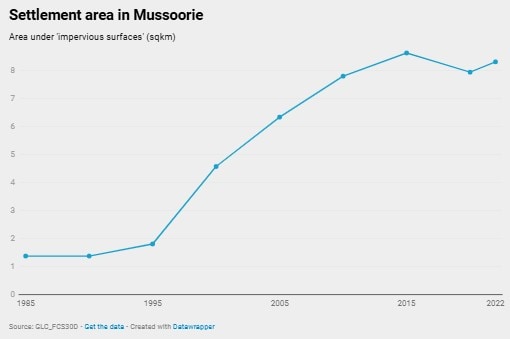
These numbers must be read with the fact that satellite-derived datasets are not perfect.
One important reason for this is that satellites now take more snapshots of a place than they did in the 1980s and 1990s, allowing for better classification now than earlier.
Moreover, this analysis is based on the Global Land Cover with fine classification system at 30m (GLC_FCS30) data, which uses Landsat imagery to assign land cover at 30 metres resolution from 1985 to 2022.
While this is the highest available resolution for long-term data, it affects how much of the land will qualify as “impervious surfaces”, the GLC category considered a proxy for settlements.
For example, if a structure is constructed that covers less than half of a 30 m x 30 m forested area, the 30 m x 30 m area is likely be designated as a forest even after a structure has appeared there.
This means that the growth in impervious surfaces seen in the satellite data is more likely to be an under-estimate than an over-estimate. Therefore, the trends seen in the satellite data should be taken as indicative rather than definitive.
With the caveats in place, are there particular hotspots of settlement growth in Mussoorie AC?
Identifying the hotspots
To find such hotspots, HT divided the assembly constituency into roughly 1 km x 1 km grids and tracked changes in land cover within each grid.
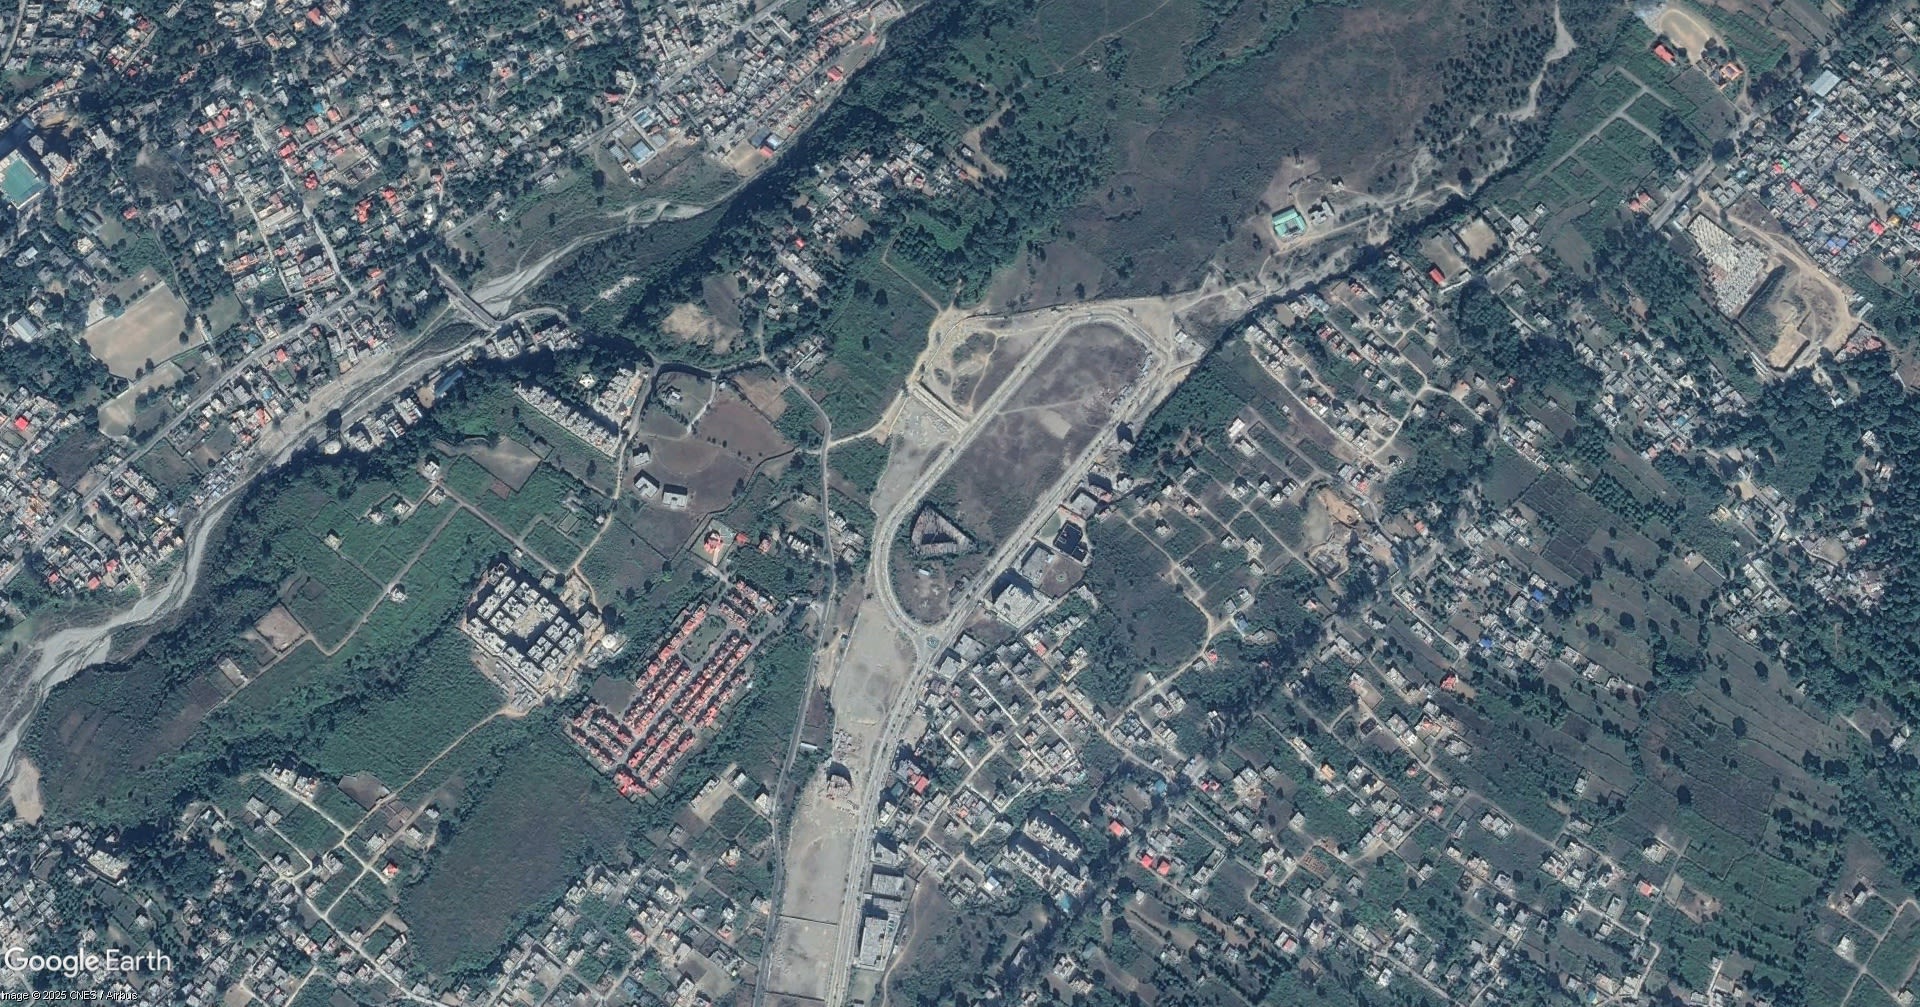
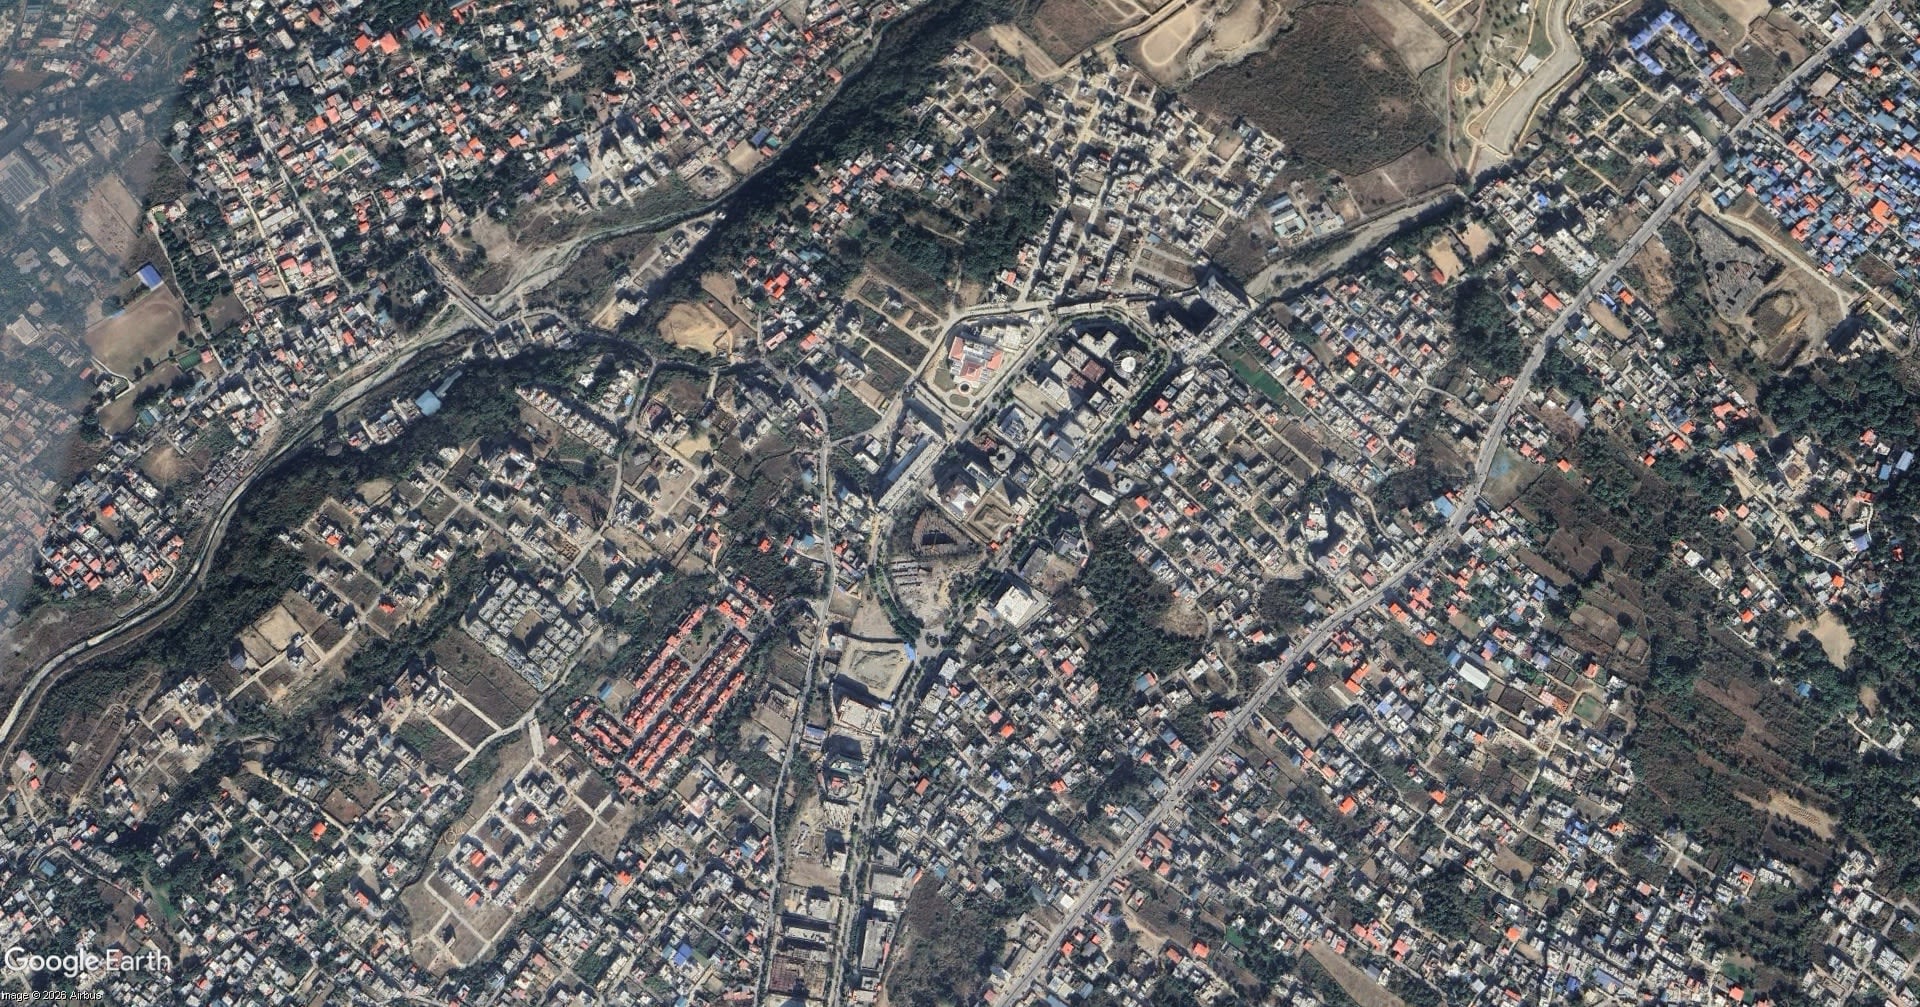
The grid with the biggest growth in impervious surfaces was in the Doon IT Park region of Dehradun at the southern edge of the Mussoorie AC. Between 1985 and 2022, this 1 square kilometre saw impervious surfaces increase by 0.397 square kilometres, which is equivalent to a square of size 630 m x 630 m.
(In the images above is the Doon IT Park region, for example, where this change can be seen in true colour imagery from 2013 and 2025.)
Reading between
the pixels
To be sure, it is not possible to see the change in settlements from 1980s onward in the colours that human eyes can interpret (called true colour imagery).
Land cover datasets classify an area based on satellite data beyond the wavelengths that human eyes can see, as well as other information.
However, even human eyes can see some changes that have taken place in the past decade and a half, when satellite imagery is available at an even higher resolution.
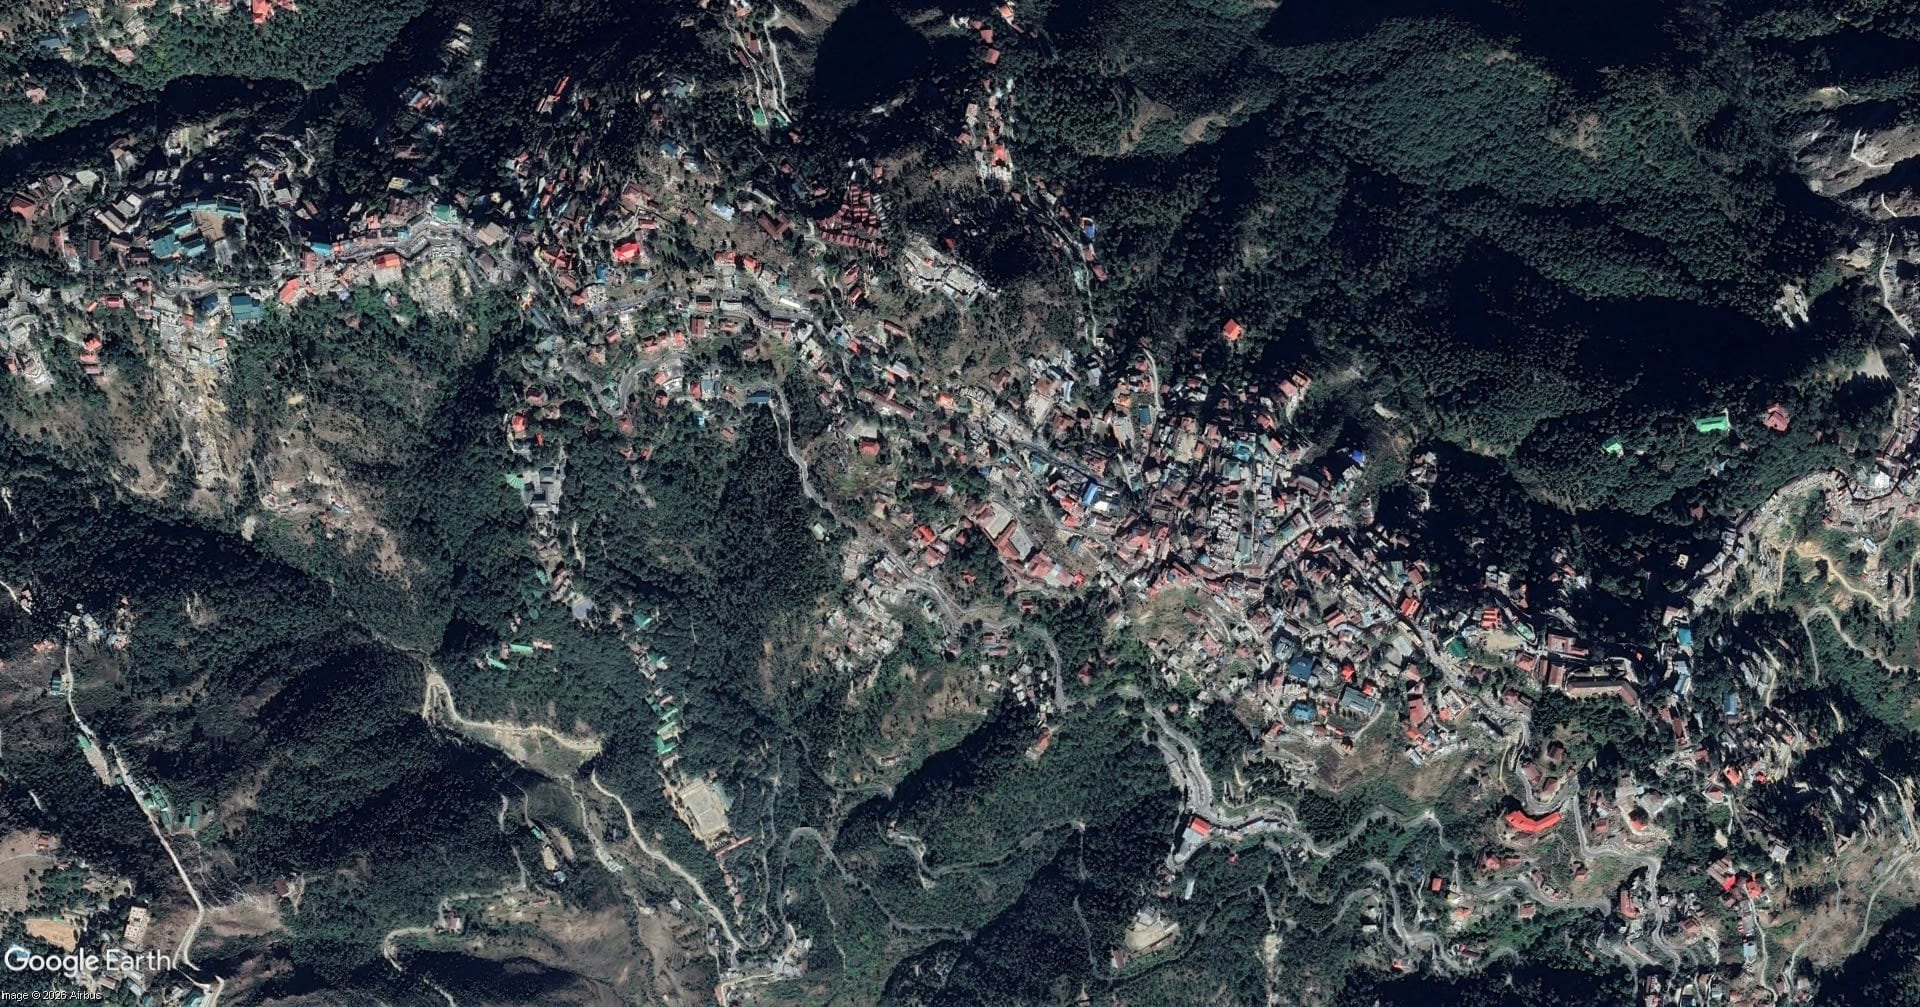
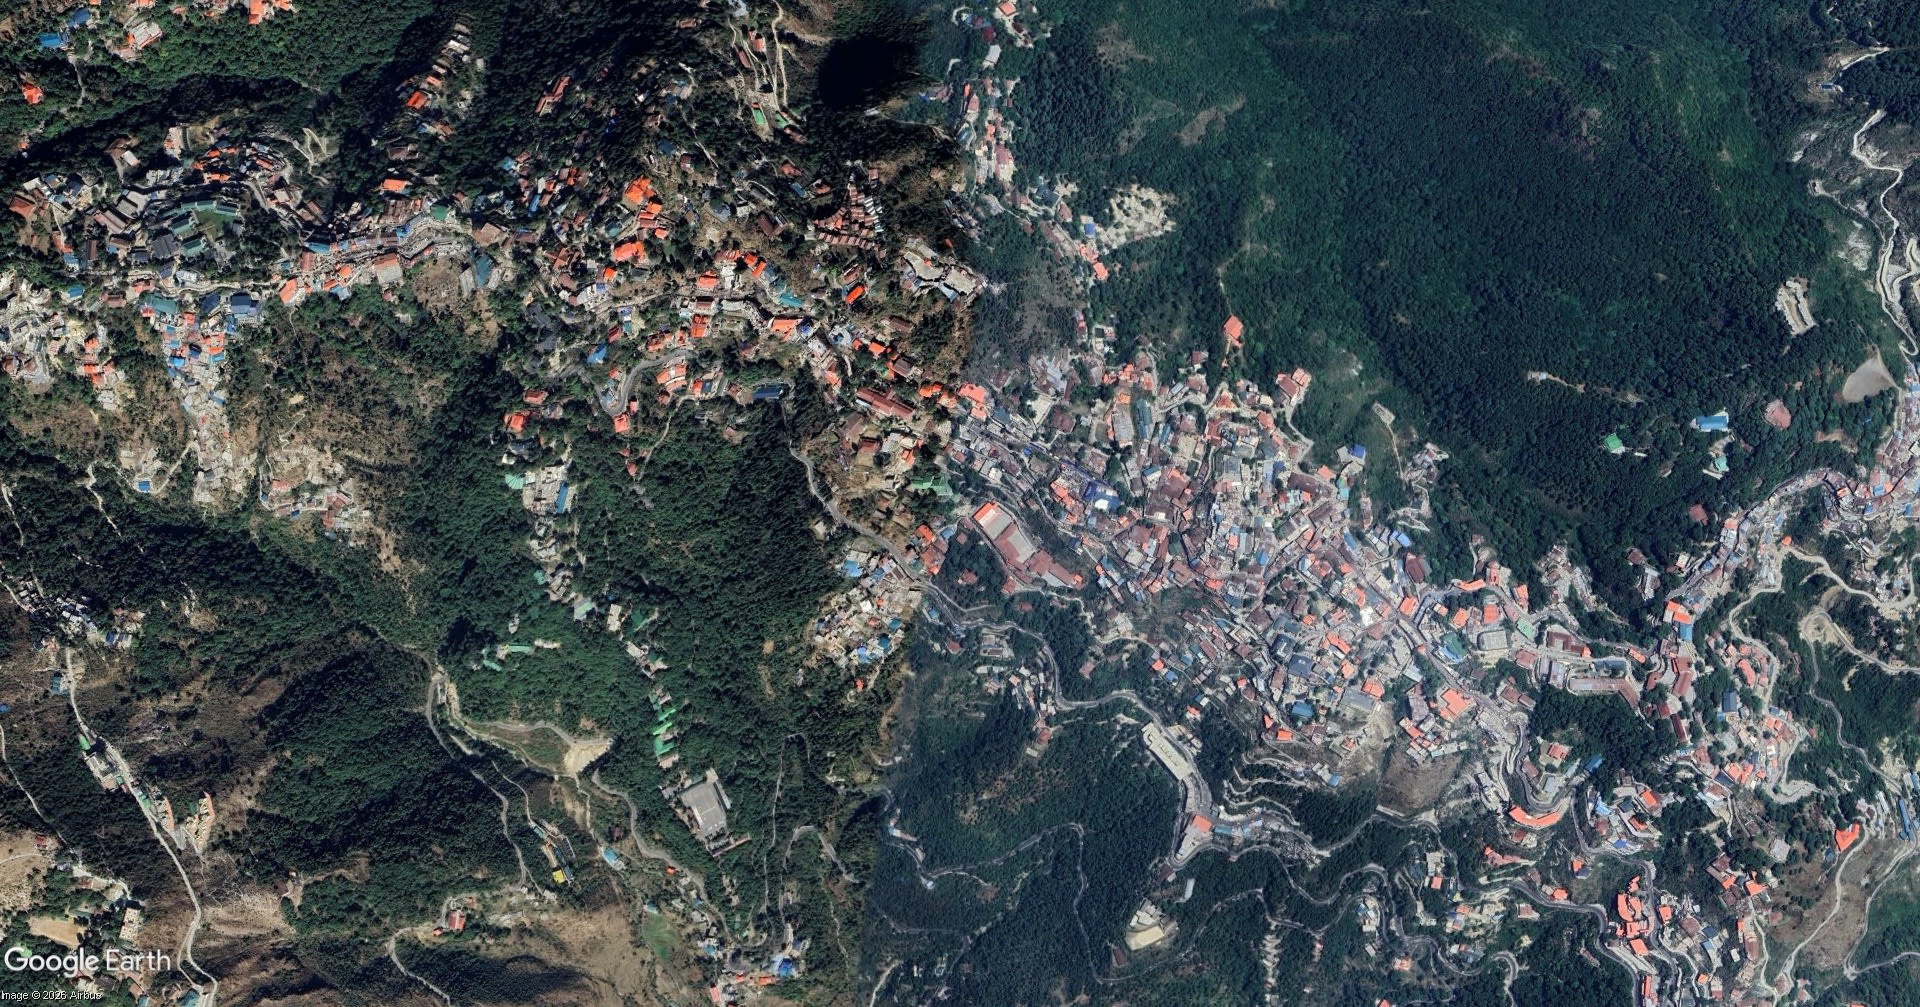
A grid within Mussoorie’s municipal boundaries – it is ranked 12th among 256 grids by the growth in impervious area – is also a region where there has been some growth in settlements since 2013 that can be seen in true colour imagery.
A closer look at a stretch of a road shows the new constructions from 2013 to 2025.