E-Paper



Number Theory: What led to the historic heatwave this summer?
This is the first of a two-part series on the ongoing heatwave in India. The second part will look at the factors making the heat wave feel unbearable.
Updated on: Jun 21, 2024, 08:10:17 IST

 Prefer HTon Google
Share via


Copy link

The heat in June, anecdotal accounts suggest, was historic and unbearable. An example of such accounts is those of heat-related deaths although with medical certification of death far from foolproof, the number of heat wave deaths may not show correct trends. Can other numbers show the scale of this crisis? This first of a two-part data series looks at how maximum temperatures recorded in the past month — starting mid-May — were unprecedented for large parts of north-western India. The second part will look at signs of how bad the summer has been in other parts of the country, such as in Bihar and Odisha, where temperatures were not as record-breaking but still led to significant reports of heat-related fatalities and illness.
What led to the historic heatwave this summer?
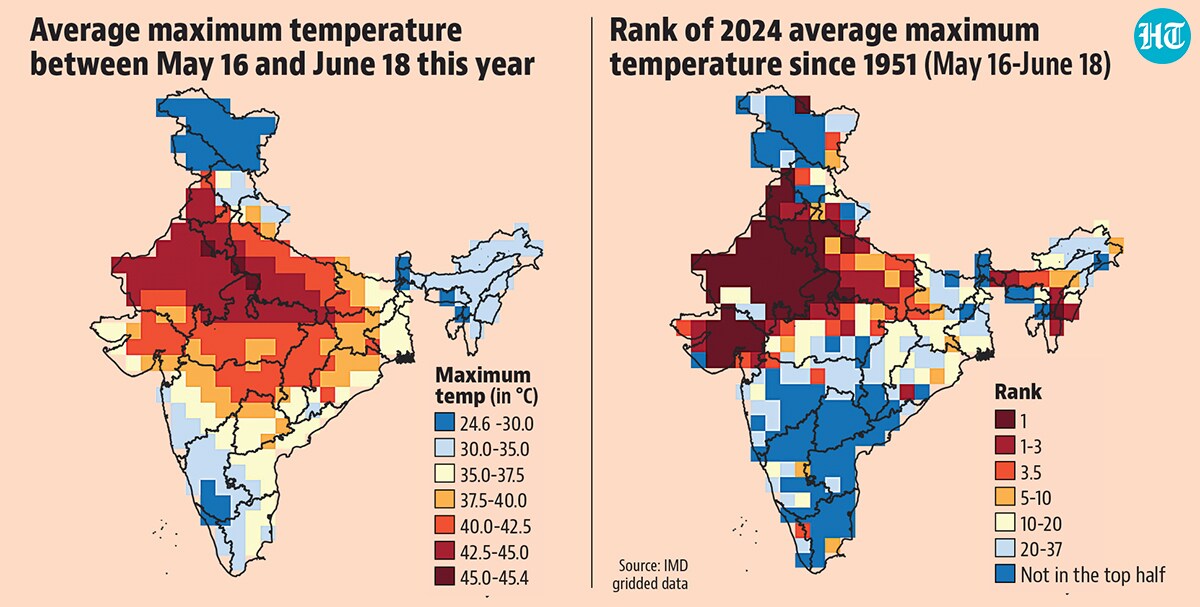
 How high and unprecedented are maximum temperatures?In 39.5% of India, the average maximum of the May 16-June 18 period was more than 40°C, according to the gridded dataset of the India Meteorological Department (IMD). Almost all of this area was in central or north-western India. This means that over 80% of Madhya Pradesh, Uttar Pradesh, Rajasthan, Haryana, and Punjab; and 37%-63% of Jharkhand, Gujarat, and Chhattisgarh experienced an average maximum of more than 40°C. In 3%-4% of Rajasthan, Madhya Pradesh, and Uttar Pradesh, the average maximum was above 45°C. Such an area calculation is not possible for Delhi because of its small size but Delhi’s average maximum in this period was also very high: 44.5°C. These numbers may not appear extreme when 45°C+ maximum temperatures are reported regularly. However, a 40°C+ average over a 34-day period suggests a prolonged period of high heat. This is what an HT analysis pointed out on June 19. It can also be seen in the rank of the average maximum for this 34-day period. The average for 2024 is ranked the highest since 1951 (the earliest available data) for 60%-87% of Gujarat, Rajasthan, Punjab, and Haryana. Similarly, 27% of Uttar Pradesh was the hottest on average this year in the 34-day period, with 66% of the state experiencing an average maximum ranked in the top three. Delhi’s average is also the highest for this period since 1951. HT chose this 34-day period because western disturbances had kept the first half of May relatively cooler in the northern half of India. It is after these storms abated that the temperature soared.
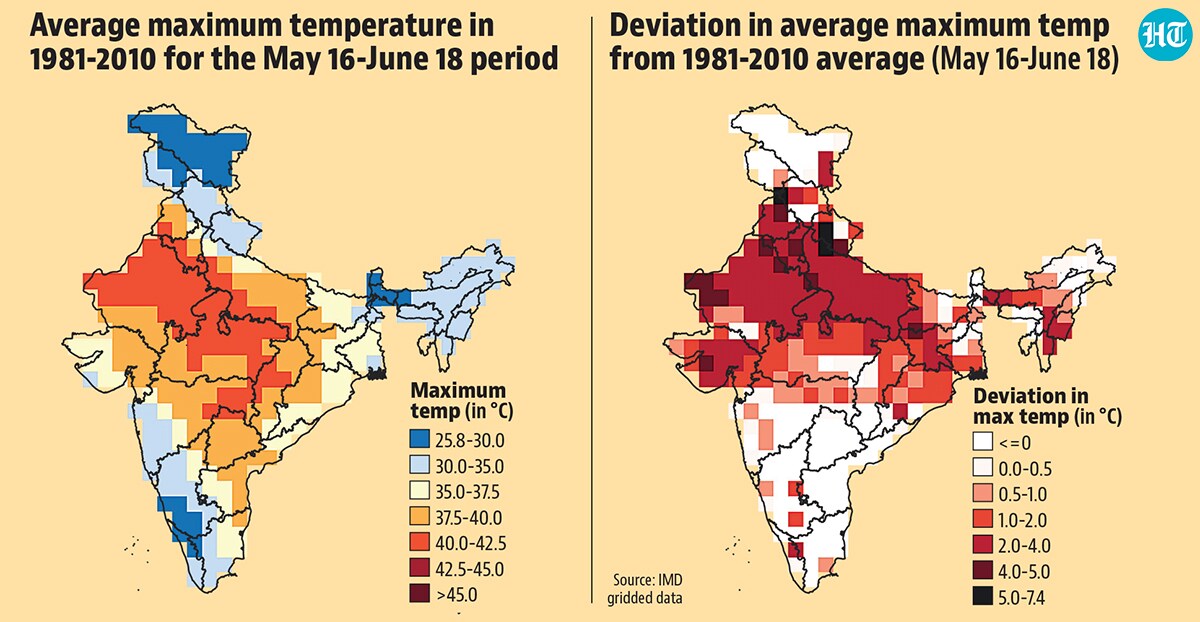
- Even a normal summer would be dangerous, but 2024 deviated far above thatThis can be seen by drawing a map of normal temperatures – considered as the average temperature in the 1981-2010 period -- with the same categories as in the first section. This map appears less dangerous than the one for 2024, although a large part of India still averages close to 40°C, which is not pleasant. The reason why 2024 felt much worse in the past month is that the deviation from normal was big in large parts. The deviation from normal was of more than 1°C in 48% of India, and of more than 2°C in 32%. All of Uttar Pradesh, Punjab, and Haryana was warmer than normal by more than 2°C. In fact, all of Punjab and Haryana, and more than half of Rajasthan and Uttar Pradesh was warmer by more than 3°C. The average deviation for Delhi also was 3.5°C. This is why the average maximum for the May 16-June 18 period reached close to or beyond 45°C in 2024 in parts of India. In the map for the normal average maximum for this period, the highest value is 41.97°C.
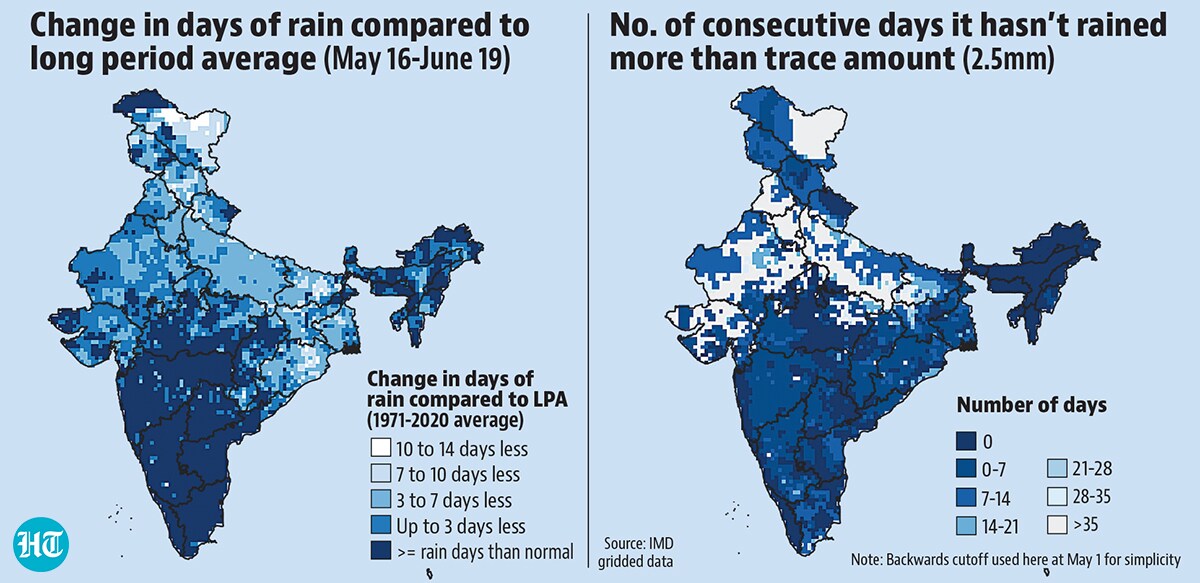
- Rain does not fall regularly over NW India at this time, but a long dry streak worsened itLack of rain was the immediate reason why temperatures in the past month have averaged very high. However, reading this mechanically may be deceptive. The deviation of number of days of rain (or rain days) from normal does not appear very drastic in north-western India since May 16: only up to seven days less than normal. However, if those missing seven days of rain were distributed over multiple weeks – as is the case with pre-monsoon showers – it could have regulated temperatures. That did not happen this year. The continuous streak of no rain/only very light rain (classified as rain of under 2.5 mm) became very long in northwestern parts of the country by June 19. The streak was more than 21-days-long in more than half of Haryana, Punjab, and Uttar Pradesh on June 19; and over 40% of Rajasthan and Gujarat. Delhi – where such area calculation is not possible – this streak was 108 days long on June 19, with no rain at all since June 7.