E-Paper



Number Theory: Thank the weather for post-Diwali clean air
the air quality on the morning after Diwali must not be taken as proof that fewer firecrackers were burst this year or their bursting did not pollute the air
Updated on: Nov 2, 2024, 16:43:03 IST

 Prefer HTon Google
Share via


Copy link

Delhi woke up to relatively cleaner air and clearer skies after Diwali this year as compared to previous years. But it was neither citizens observing the official ban on firecrackers, nor these firecrackers somehow not leading to massive spikes in pollution that led to this. In fact, it was a stroke of pure weather-induced luck. Here are four data points that explain this in detail.
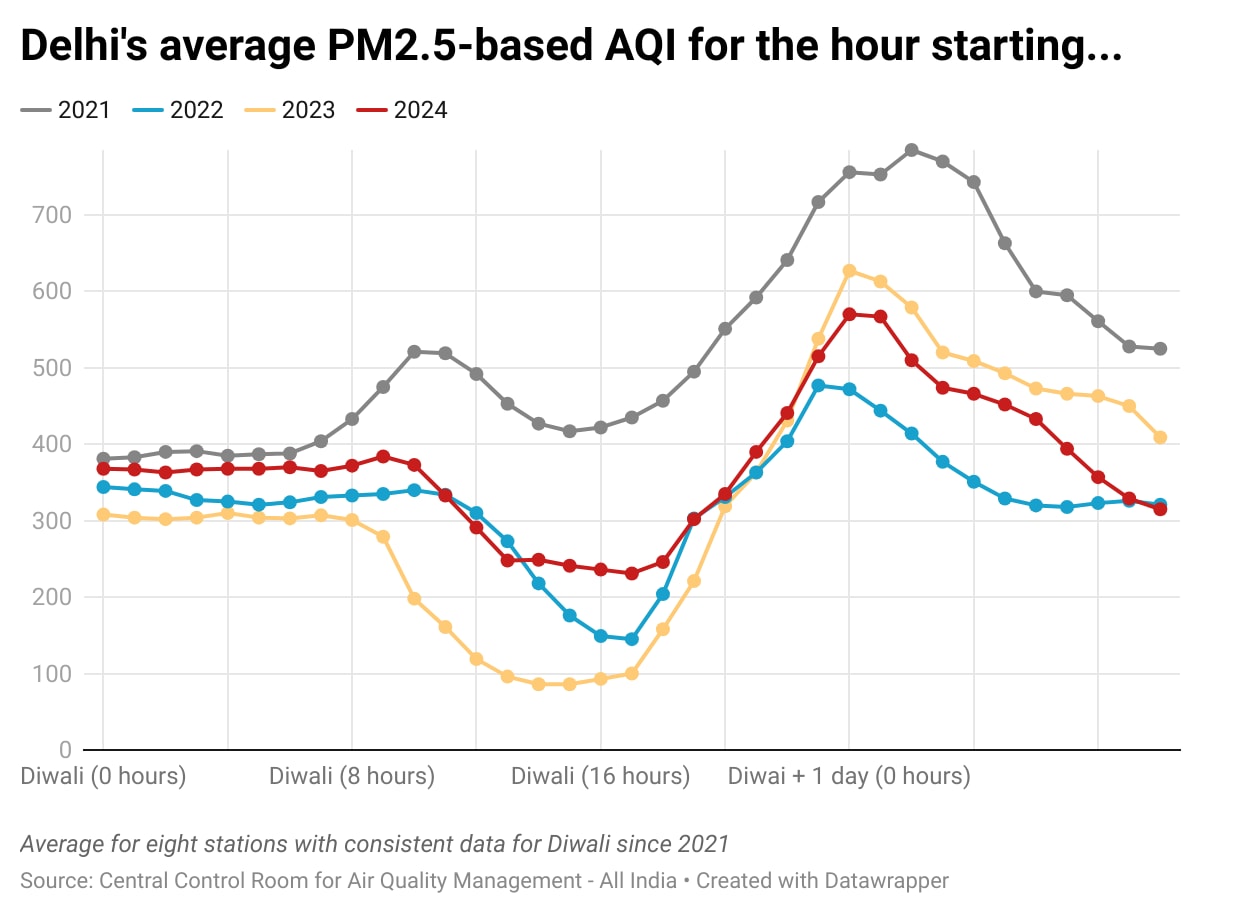
 Diwali night no differentAt the eight stations with long-term consistent data for Diwali (more on this later), the average PM2.5 concentration converted to Air Quality Index (AQI) in 2024 was only 25 points better than the 2021-2023 average for the last 12 hours of the day of Diwali (noon to midnight). In the four years from 2021 to 2024, the average AQI for the noon to midnight period this year was better than the AQI only in 2021. To be sure, the 8pm to 2am AQI was 52 points better than the 2021-2023 average. As the accompanying chart shows, this was roughly a similar Diwali night in terms of AQI as that experienced in 2023. For example, the average AQI for the 8 PM to 2 AM period this year was 470, only marginally better than the AQI of 482 recorded in 2023. However, the morning after Diwali (taken here as the 8am to 11am period) was 100 points better than the 2021-2023 average of 434 and more like the Diwali in 2022 when strong winds led to the cleanest mornings after the Diwali in recent years. To put it simply, the air quality on the morning after Diwali must not be taken as proof that fewer firecrackers were burst this year or their bursting did not pollute the air. So, what really happened?
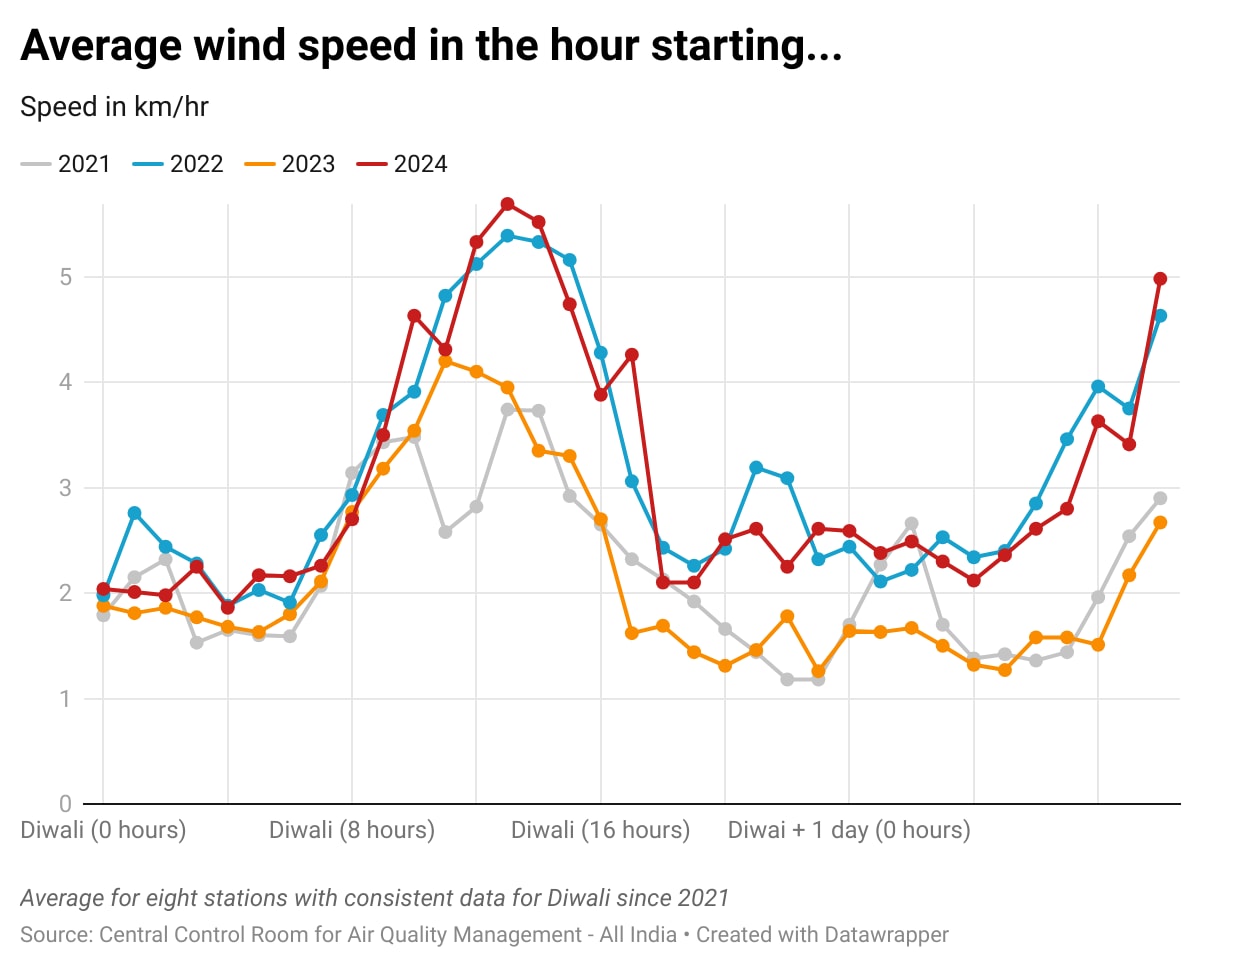
- Relatively faster wind speed played a major roleThis can be seen in the accompanying chart. The average wind speed at the eight stations listed above averaged 4 km/hr from 8 AM to 11 AM on November 1 compared to 2.5 km/hr and 2.1 km/hr on the morning after Diwali in 2021 and 2023, when the air quality on Diwali night and the morning after was much worse. In fact, the wind-speed this year was more at the level of that in 2022, another year when wind and rain helped clean Delhi’s air.
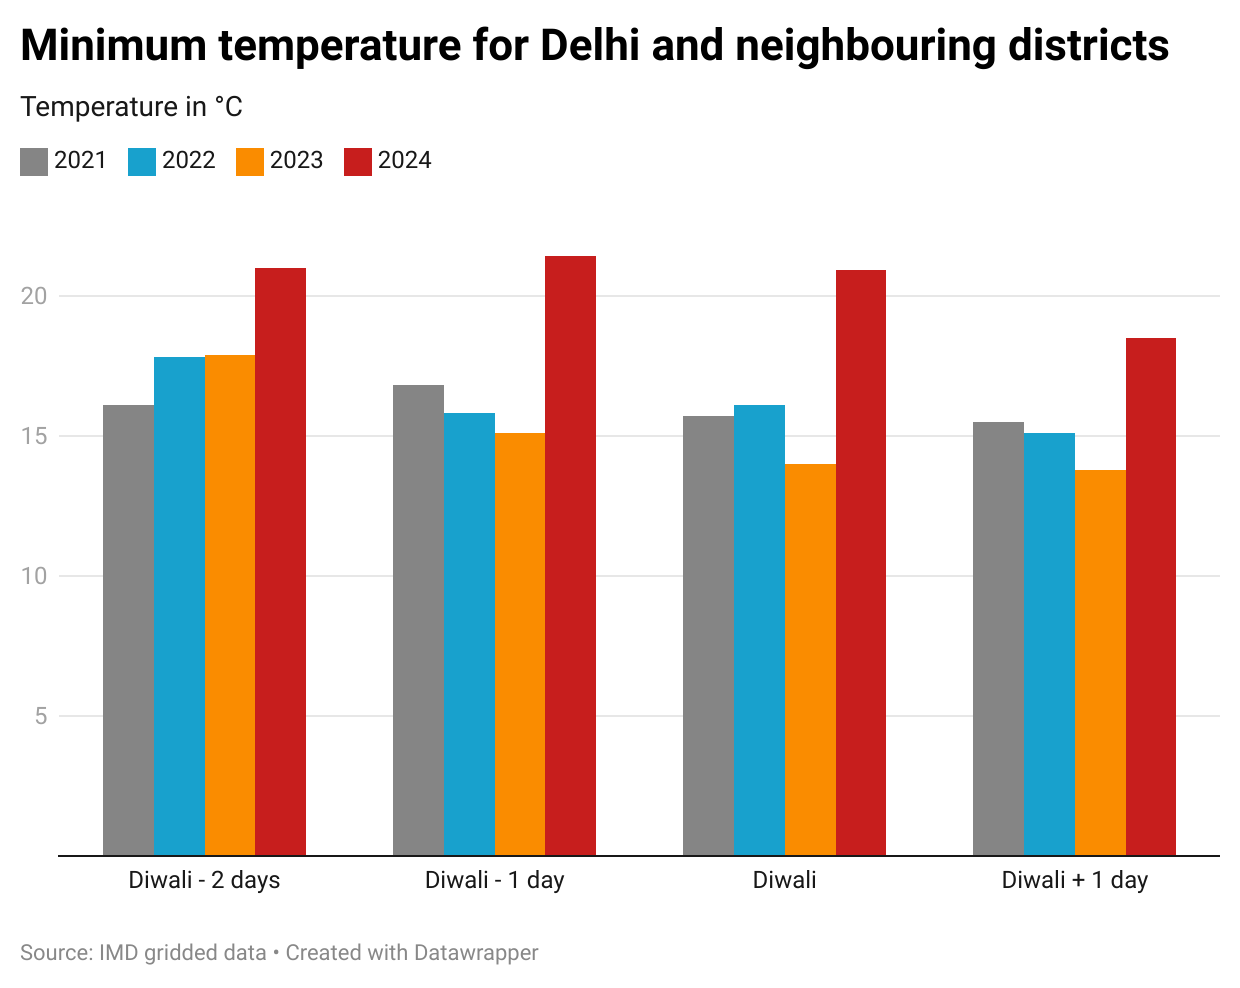
- A much warmer DiwaliApart from the wind, temperatures also play in role in air quality. Lower temperatures allow pollutants to accumulate closer to the ground, leading to dirtier air. Diwali this year had the most help from temperature than any other Diwali in recent years. According to the gridded data of the India Meteorological Department (IMD), the minimum temperature recorded for Delhi (IMD’s grids cover an area somewhat bigger than the city’s political boundaries) in the early hours of November 1 was 18.5°C. This is 3°C warmer than the warmest Diwali morning from 2021 to 2023. This is only partly a function of the fact that this is a somewhat early Diwali. This Diwali morning would be warmer than any Diwali celebrated on the same date. This is because this was the warmest November 1 minimum temperature recorded since 1951, the earliest year for which this data is available.
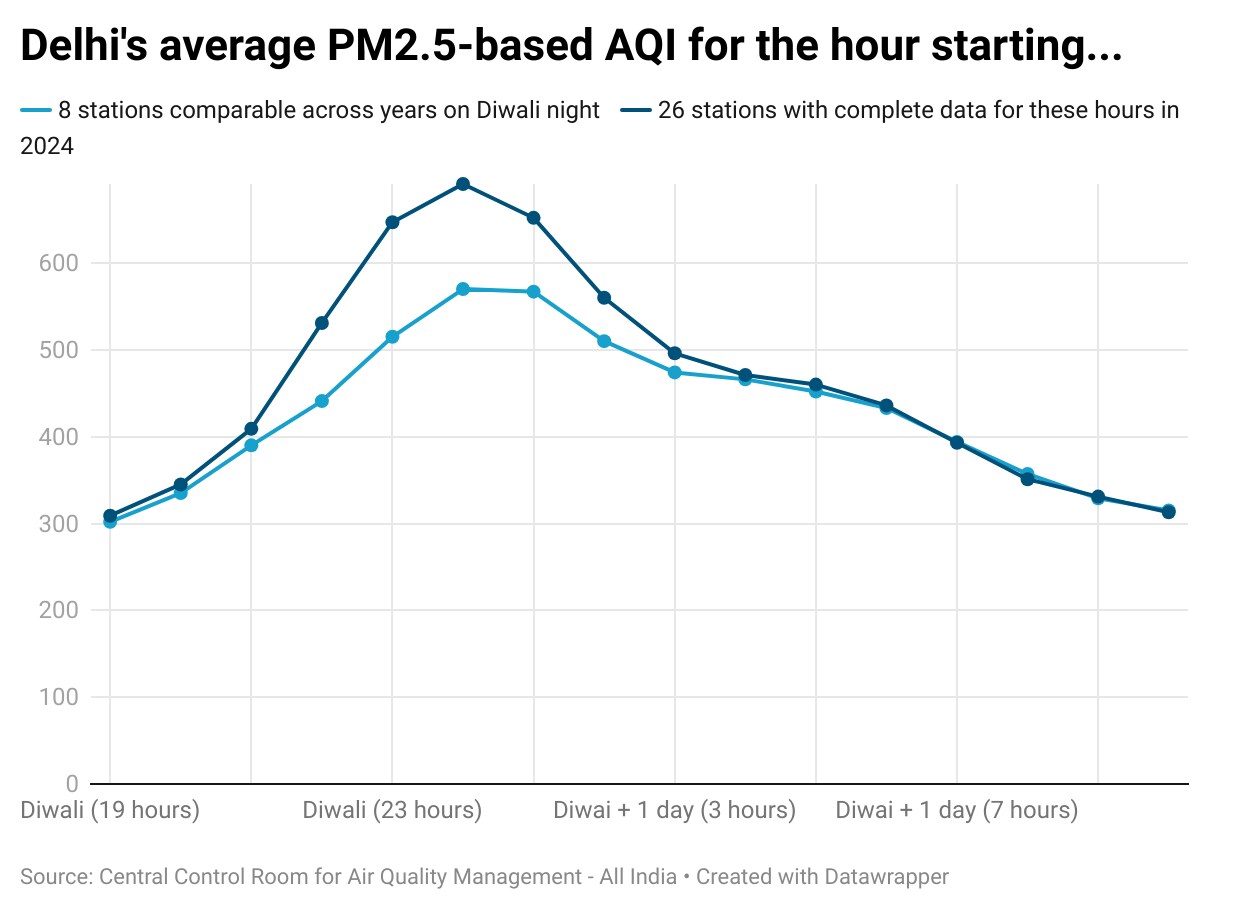
- Lastly, a caveat...Comparing Delhi’s air quality on Diwali across years faces a statistical handicap. This is because some monitoring stations malfunction when the pollution is abnormally high. What is worse is that the stations that malfunction are not the same across years. For example, only five of 40 operational stations have near-complete hourly data for PM2.5 (particles of diameter 2.5 micrometers or less) and wind speed around Diwali since 2019. They are Bawana, Dilshad Garden, Najafgarh, Narela, and Punjabi Bagh. The number increases to eight if one is making comparisons since 2021, with the three additional stations being in Mundka, Rohini, and Sri Aurobindo Marg. Since the list of eight provides slightly better geographical representation than the first five, HT has used this for the anlaysis above. However, this misses the worst excesses of firecracker burning. For example, for 2024, 26 stations have complete data for the period from 7pm on October 31 to 11am on November 1. The average AQI at these stations for midnight to 1am was 691 compared to an average of 570 at the eight stations used in the rest of this analysis. This suggests that Delhi’s average pollution levels this Diwali were higher than what this analysis has used to make inter-year comparisons. The weather, not the government or the people, came to the rescue.