
 E-Paper



Number Theory: Why has the heatwave taken such a heavy toll?
The average minimum for the May 16-June 19 was the highest since at least 1951

 Prefer HTon Google


The first part of this series looked at the most common indicator of extreme heat – maximum temperatures – to show how the summer this year is unprecedented in large parts of northwestern India. However, high maximum temperatures are not the only factor that makes heat unbearable, an HT analysis shows. For example, northwestern regions are not the only ones from where heat-related deaths have been reported in the past month — states such as Bihar and Odisha, where maximum temperatures do not appear as extreme as in northwestern India, also reported large numbers of fatalities. This suggests that more indicators are needed to describe the heatwave of the past month, which is what the following four maps attempt.
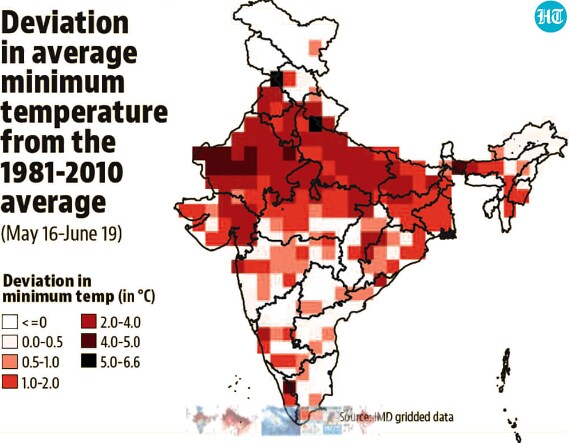
 Minimum was more than 2°C above normal in the past month in at least 75% of Rajasthan, Punjab, Haryana, and UPThis is a big reason why the heatwave of the past month felt unbearable. Not only were temperatures very high during the day (as seen in record-breaking maximum temperatures), they were also very high during the night. The trend in night temperatures can be seen through minimum temperatures. In the May 16-June 19 period, 75%-87% of Rajasthan, Punjab, Haryana, and Uttar Pradesh experienced minimum temperatures that were on average 2°C or more above normal (considered as the average temperature in the 1981-2010 period). Delhi, where such area calculation is not possible using the gridded dataset because of its small size, had an average minimum in this period 3.4°C above normal. To be sure, 40%-50% of Gujarat, Bihar, and Kerala also experienced more than 2°C of deviation in minimum temperatures.
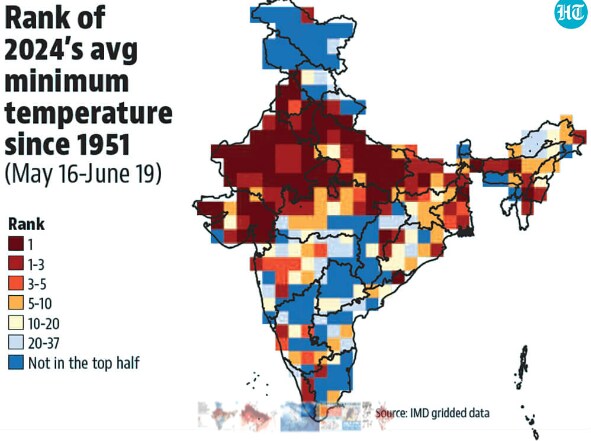
- How unprecedented were these minimum temperatures?The average minimum for the May 16-June 19 period was the highest since at least 1951 – the first year for which IMD has created gridded data for temperatures — in 69%-75% of Uttar Pradesh, Haryana, Punjab, Rajasthan, and Gujarat. Delhi’s average minimum was also the highest since at least 1951. Clearly, even night-time temperatures have been unprecedented in large parts of northwestern India. To be sure, minimum temperatures were not cool in eastern states like Bihar or Odisha. Although only 10% of Bihar and no part of Odisha experienced its warmest ever minimum temperatures in this period, 70% of the former 23% of the latter experienced an average minimum ranked in the top three since 1951.
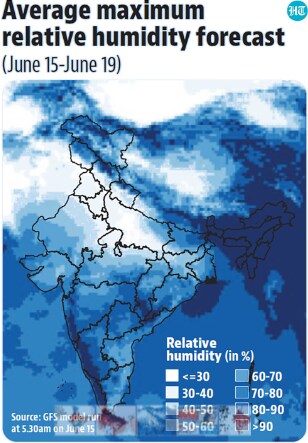
- Eastern states may not have suffered high temperatures, but they had very high humidityThe two sections above show why the heat felt unbearable in northwestern states. However, even minimum temperatures do not appear as extreme in eastern states. What, then, explains the heatwave related deaths there? The answer appears to be humidity. While there is no comprehensive database of humidity that covers all of India, forecasts from the Global Forecast System (GFS) of the US National Weather Service (NWS) give a reasonable approximation of this metric for the past week. HT calculated the average of the maximum hourly humidity across India for the past five days (forecasts are for bigger intervals for the period after). This suggests that the nature of the heatwave in eastern parts or even Gujarat and the adjoining parts of Rajasthan may have been very different from that in Punjab, Haryana, Delhi, and western Uttar Pradesh. The former regions had much higher humidity than the latter ones. This is dangerous because humidity makes it difficult for the body to lose heat.
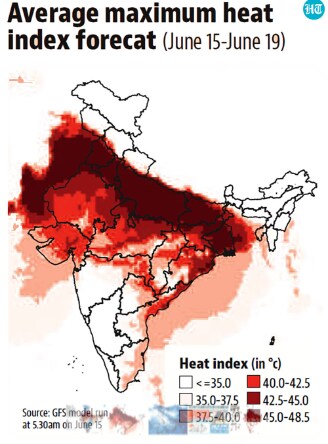
- Therefore, heat index in eastern states was at par with north-western statesTo be sure, humidity becomes dangerous only when accompanied with some heat. For example, northeastern and peninsular states have also experienced high humidity, but that is because it is raining there. Therefore, humidity has to be read with temperatures to understand its impact on the human body. This is what the heat index does, a metric that combines the impact of temperature and humidity. HT calculated the daily maximum of heat index – using forecasts from the GFS – for the past five days. This shows that all of Punjab, Haryana, Delhi, and Uttar Pradesh; and over 95% of Bihar, Jharkhand, and Rajasthan had an average maximum heat index over 40°C in the past five days. This was also the case in 64%-84% of Odisha, West Bengal, Madhya Pradesh, and Gujarat. Clearly, while high temperatures did not cover large parts of eastern states, the heat was as dangerous there as in northwestern states. This is why heatwave-related deaths have been reported from across most parts of the northern half of India in the past month.
This is the final part of a two-part data series on the past month’s heat wave in India. The first part at the extreme maximum temperatures recorded in the heatwave.



