E-Paper



Number Theory: The jobs that have been created in the past 5 years
This is the second part of a four-part data journalism series on the key trends seen in the Periodic Labour Force Survey.
Updated on: Dec 25, 2023, 12:04:53 IST

 Prefer HTon Google
Share via


Copy link

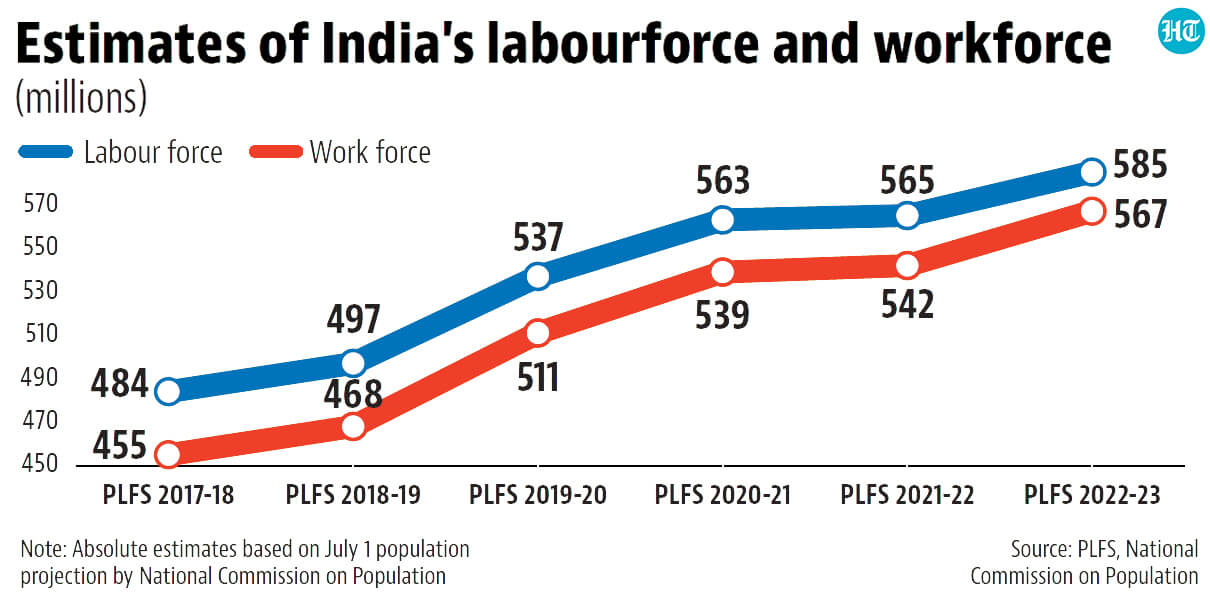
India’s labour force increased by 101 million between 2017-18 and 2022-23. This was largely because women’s labour force participation in rural areas increased. If new jobs are not created, such growth in labour force (part of the population working or looking for a job) usually leads to a rise in the unemployment rate. However, the headline unemployment rate has not increased in India in the PLFS series. In fact, it has decreased from 6.1% in 2017-18 to 3.2% in 2022-23. Clearly, people who joined the labour force did so because there were jobs available for them. What jobs were these? Here are five charts that show this.
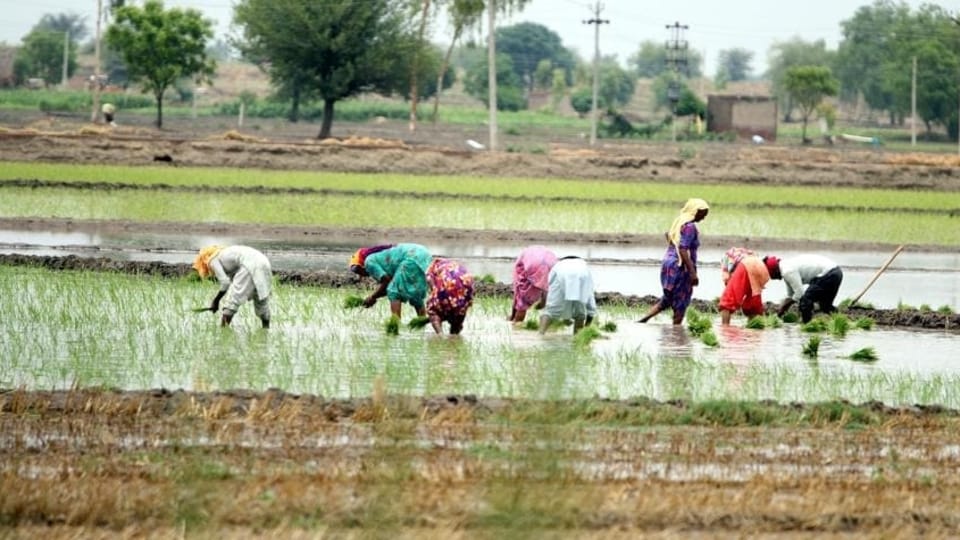
112 million workers added since 2017-18 in India
 112 million workers added since 2017-18 in IndiaIf the unemployment rate decreases when labour force is growing, it means that more jobs than job seekers have been added to the labour market. This is indeed the case. If the ratios from the Periodic Labour Force Survey (PLFS) are applied to India’s projected population, India’s workforce in 2022-23 is 567 million in 2022-23. This number was only 455 million in the first PLFS conducted in 2017-18. This means an addition of 112 million jobs. In comparison, the labour force has only grown by 101 million in this period. This explains why India’s headline unemployment rate has fallen in the PLFS series.
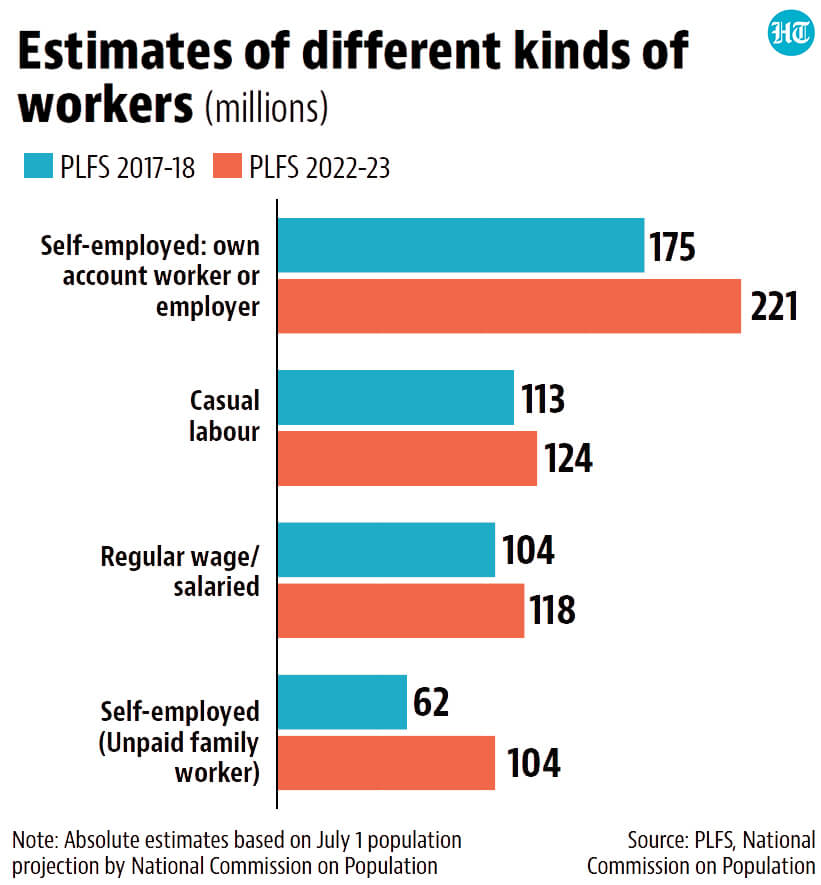
- But more than one-third of the workforce is unpaid family workersTo be sure, not all the growth in India’s workforce is because of gainfully employed people. PLFS also counts those working as unpaid family workers (also known as self-employed helpers in household enterprises) as employed. Such workers are responsible for 37% of the 112-million growth in the workforce since 2017-18. Casual workers, who earn the least among the three broad type of workers in PLFS, have contributed another 9%. Those self-employed as own account workers or employers have contributed 41%. Regular wage or salaried workers, who are the best paid workers, have contributed only 13%. This is expected. Since 2019-20, the first PLFS year (it runs from July to June) to be affected by the Covid-19 pandemic, the proportion of salaried among workers has decreased and that of unpaid workers has increased.
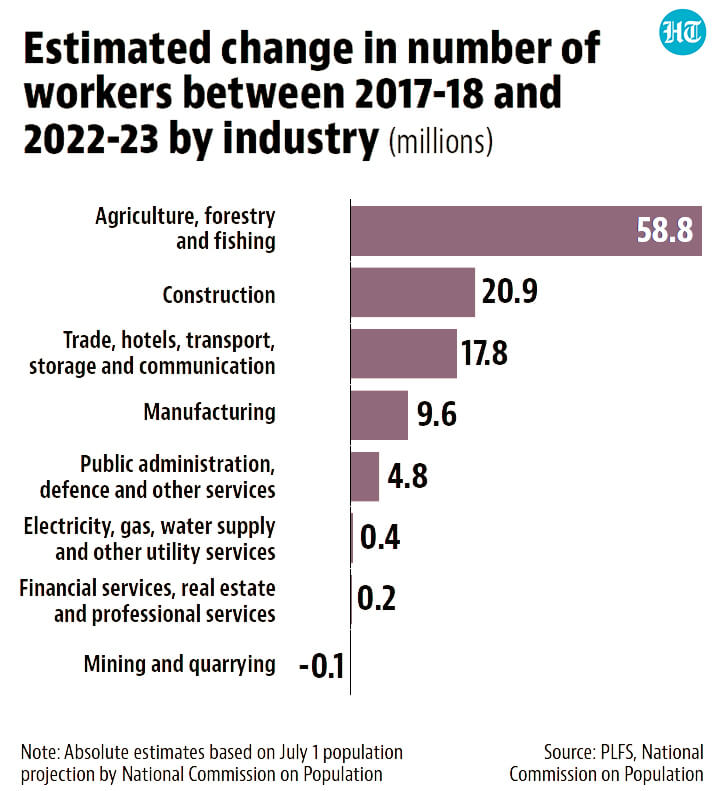
- Agriculture is responsible for over half the growth in workers since 2017-18This is another reason to worry: 52% of the 112-million growth in workers is from just agriculture. Another 43% of the growth has come from three industries. These are the construction industry; the trade, hotels, transport, storage and communication industry (henceforth ‘trade’); and the manufacturing industry. These numbers can also be broken down by the type of workers from these industries. This shows that unpaid workers have come mostly from agriculture and trade. Most of the contribution by own account self-employed workers is also from these two industries. Salaried workers, on the other hand, have come from manufacturing, trade, and government-related services.
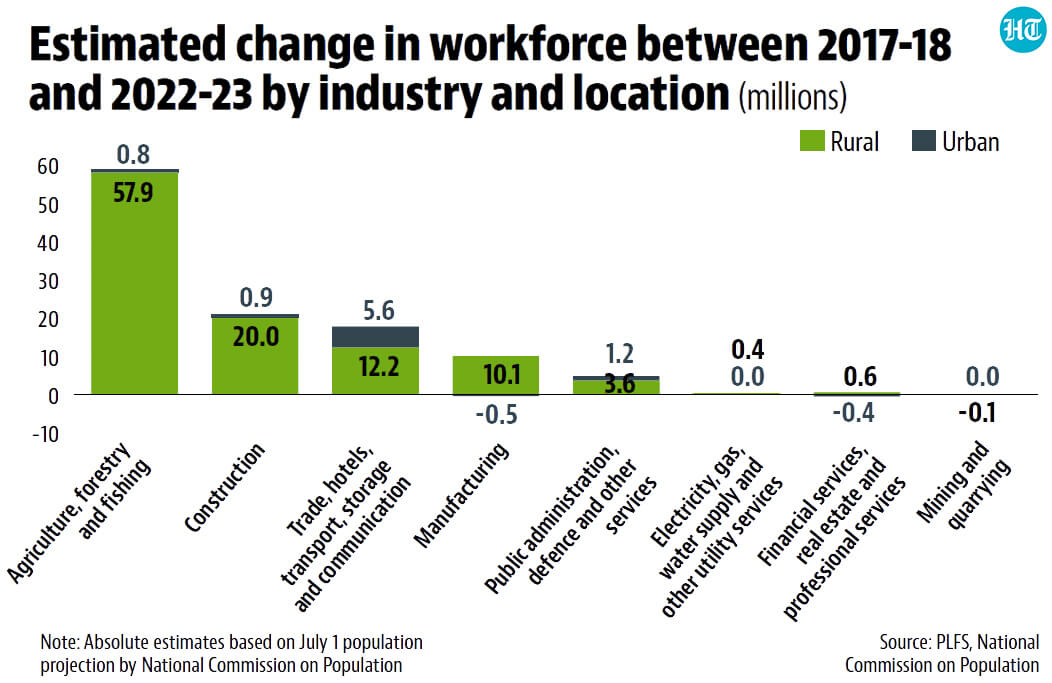
- The workforce growth in manufacturing and trade was also in rural areasManufacturing and trade are the only two big employers in India where a majority of workers in 2017-18 were urban. However, the growth in the workers in these sectors has been overwhelmingly rural. Rural workers in manufacturing have increased by an estimated 10.1 million in this period while urban workers have decreased by 0.5 million. Similarly, 12 of the 18 million workers added to construction were in rural areas. The growth in employment in agriculture and construction (where the majority of workers were rural even before) has also come from rural areas. This means that almost all the growth in the workforce between 2017-18 and 2022-23 has been in rural areas. Rural workers have grown by 104.7 million while urban workers have grown by just 7.6 million in this period.
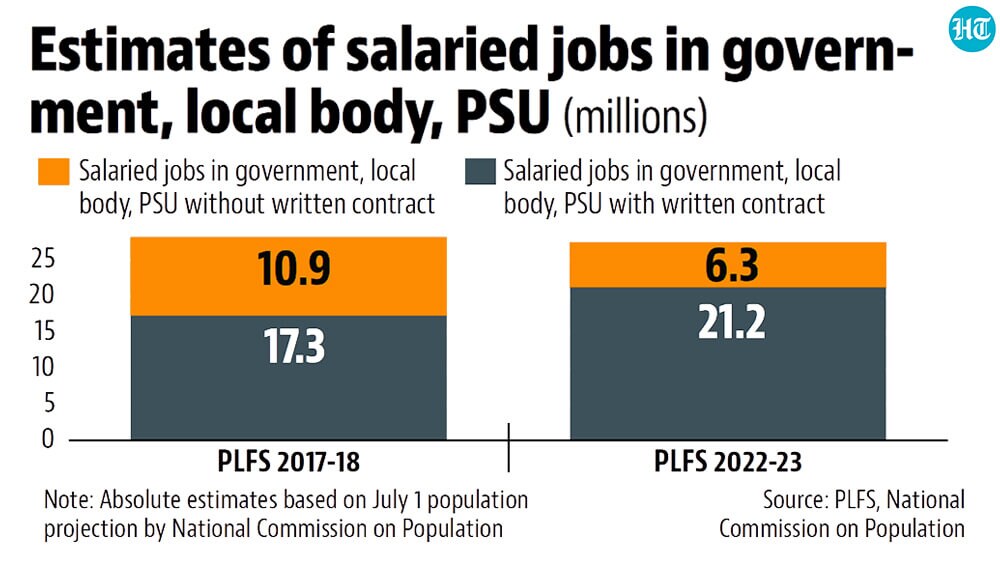
- Salaried government jobs have not contributed to job growthWhile recent surveys around elections have shown unemployment as a big issue, large-scale protests generally erupt only around government jobs that pay a regular wage. If PLFS estimates are applied to population projections, such jobs seem to have marginally decreased since 2017-18. There were an estimated 28.2 million regular wage jobs in government, local bodies, or public sector undertakings in 2017-18. This number decreased to 27.6 million in the 2022-23 PLFS. To be sure, the nature of these jobs has undergone a positive shift during this period. The proportion of such jobs that came with a written contract has increased from 61% to 77% in this period. Such regular wage government jobs with a written contract have also increased in absolute terms: from 17.3 million in 2017-18 to 21.2 million in 2022-23.
- This is the second part of a four-part data journalism series on the key trends seen in the Periodic Labour Force Survey. The third part will show who India’s unpaid workers are.