India’s southwest monsoon season runs officially from June to September for 122 days. With one-third of the season over, rain’s performance in the 2025 season appears to be normal at the national level. However, this has largely been accomplished by June rain and a large surplus in a small region, an HT analysis shows, with July so far the 21st driest July month in 125 years.
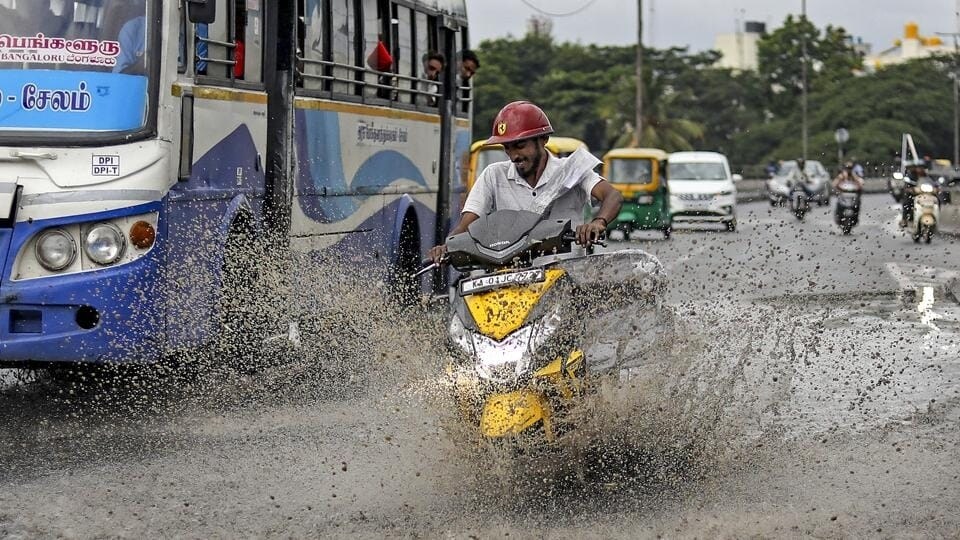
A biker rides through a waterlogged road after rainfall, in Bengaluru, on Friday. (PTI)
According to the gridded data of the India Meteorological Department (IMD), the normal rainfall for the June 1-July 10 period at the country level is 249.6 mm, which is the average rain for the 1971-2020 period and called the Long Period Average (LPA). June 1-July 10 rain in 2025 is 247.2 mm, just 1% less than the LPA. This suggests that the 2025 monsoon is progressing almost exactly as past statistics suggest. As expected from this, the rank of 2025 rain for this part of the monsoon is also roughly in the middle of the distribution: 68th highest in 125 years.
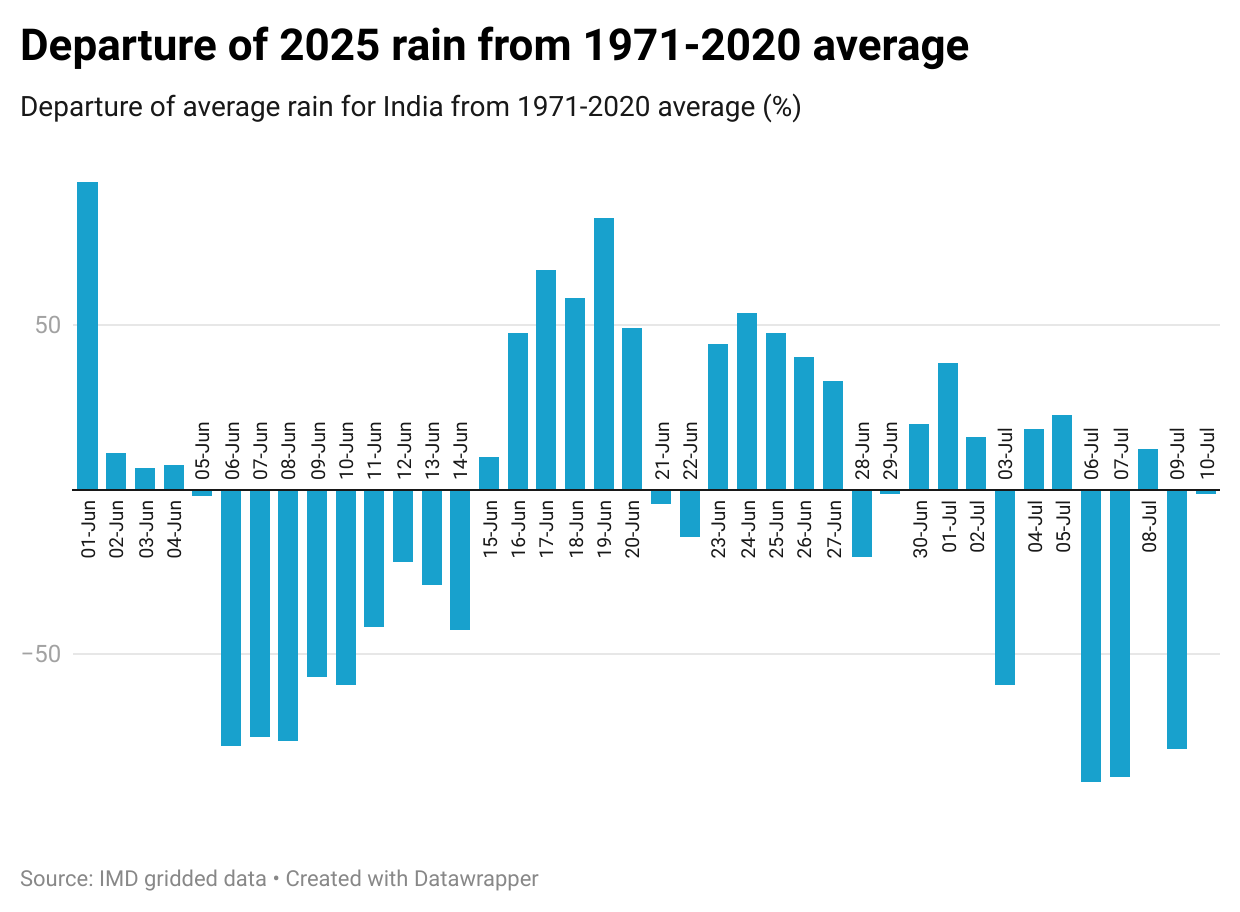
However, rain appearing normal in summary statistics does not mean that monsoon has been experienced as normal. For example, June rain was 35th highest since 1901 (the first year for which this data is available), and 9.3% more than the LPA. On the other hand, July rain so far has a 21.5% deficit, and the month is ranked 21st driest since 1901. Clearly, the season has not been normal throughout. In fact, daily trends in rain show that even the first half of June was very dry compared to the LPA.
Chart 1
There is more to abnormal rain in the 2025 monsoon season than long dry patches. Even the geographical distribution of rain is skewed. 38% of the country’s area has a deficit of 20% or more, which IMD classifies as “deficient” or “large deficient” for local rain; and 34% has a surplus of 20% or more, which IMD classifies as “excess” or “large excess”. Only around a quarter of the country (28%) has received rain within 20% of the LPA, which IMD classifies as “normal”.
To be sure, even some regions of normal and surplus rain owe that status to June rain. July rain is deficient or large deficient in 58% of the country. As the accompanying maps show, such areas of deficit include regions that average normal or surplus rain for the season as a whole. Most notable among such regions are large parts of Gujarat, southwest Rajasthan, western Madhya Pradesh, northern Maharashtra, Jharkhand, and Odisha. These regions are dry in July, but average normal or surplus rain for the season overall.
Map 1Map 2Map 3
Clearly, the broad picture of the monsoon season does not tell us that this is just as unusual a monsoon season as any India has experienced in recent years. However, while one-third of the season is past, its rainiest half (the months of July and August) has just started. There is still time for a better geographical distribution of rain.
Abhishek Jha is Assistant Editor-Data at Hindustan Times. He uses statistical programming to generate newsworthy insights from large datasets. He is part of the team that produces Number Theory, a daily data story feature of the paper’s print edition. Since March 2024, he has been writing Weather Bee, a weekly column for the Hindustan Times website. He is a chemical engineer by training, who specialises in stories related to weather, climate, and the environment.
Jha has been at HT since 2018, where he offers data-driven perspective and analysis on politics, environment, weather, climate, economy and society. His work includes data coverage of elections in India and abroad, including the 2019 and 2024 Lok Sabha elections; the disasters and extreme weather resulting from changing climate, such as floods, droughts, heat waves, cold waves, and dwindling snow cap in the Himalayas; the factors that drive poor air quality in northern India; the changing patterns of land use; the Covid-19 pandemic and its impact on labour market conditions; the changing pattern of consumer spending seen in the new consumer spending surveys; and social norms seen in the surveys such as the National Family Health Survey.Read More
Get the latest India News, breaking headlines and real-time updates from across the country. Stay informed about politics, government policies, crime, weather major national developments and Karnataka Bandh LIVE.
Home/India News/Weather Bee | Monsoon Appears Normal So Far Largely Because Of June Rain

 E-Paper