
 E-Paper



World population data: Average Indian 10 years younger than Chinese
A comparison of the south Asian region shows that India’s median age is significantly lower than that of Sri Lanka (32.99 years).

 Prefer HTon Google


The median age of India’s population is 28.2 years, data from the World Population Prospects (WPP), which forms the basis of the UNFPA report released on Wednesday, shows. This makes the average Indian 10 years younger than the average Chinese whose median age is 39 years. In terms of global rankings, India and China are ranked 94th and 170th youngest among the 237 countries for which these estimates have been made.
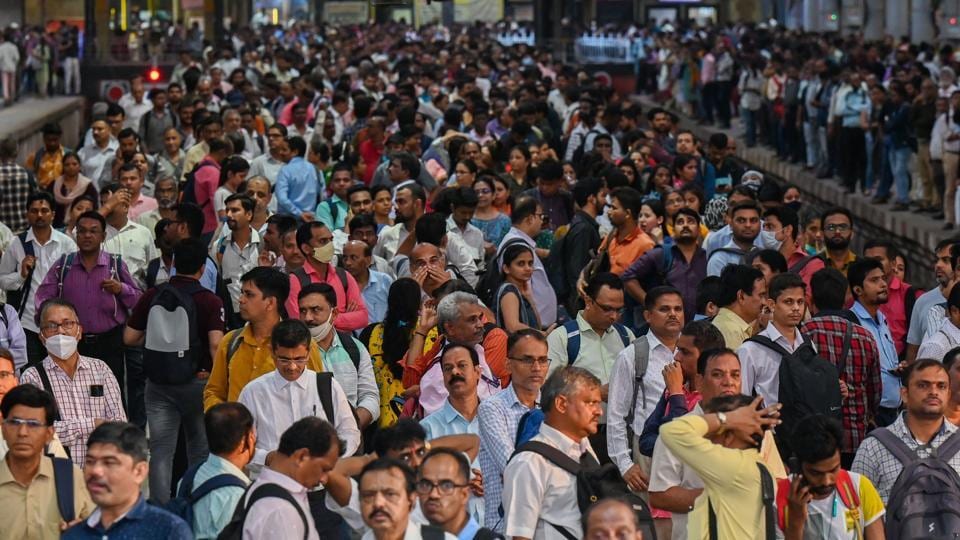
A broad-based regional analysis shows that Asia is the third youngest geographic group with a median age of 31.9 years. Africa is the youngest continent with a median age of just 18.8 years and Latin America is only marginally younger than Asia with a median age of 31 years. The median age for North America and Europe is 38.4 years and 42.2 years, respectively.
Read | India to be world’s most populous country by mid-year: UN
A comparison of the south Asian region shows that India’s median age is significantly lower than that of Sri Lanka (32.99 years) while it is older than Pakistan (20.62 years), Nepal (24.41 years), and Bangladesh (27.06 years). A long-term analysis of median age data from the WPP shows that India’s median age was the lowest in 1968 (18.23 years) and has been gradually increasing since then. For China, the median age reached the lowest in 1969 (17.96 years).
Also Read: We are many, we are one: Ambi Parameswaran on India’s population milestone
The trend in median age is broadly in sync with the trajectory of population growth rate as well. The rolling decadal CAGR (compound annual growth rate) of India’s population started decreasing from the decade ended in 1965. This CAGR increased briefly from 1975 to 1986, but has been consistently decreasing every year after that. This trend is estimated to continue up to the year 2100 as this rolling CAGR of India’s population first decreases and finally turns negative in 2070. China’s rolling decadal CAGR has been decreasing consistently since 1972 and will turn negative in just five years: in 2028.



