The Number Theory: Where is the second Covid-19 wave bigger than the first?
Is the second wave larger than the first everywhere or is that the case only in a few states? Has the rate of testing caught up with this higher second wave? HT analyses Covid-19 data to find out.
With new cases hitting a fresh high almost every day, India is currently climbing the second wave of Covid-19 infections at a much faster rate than the first. The second wave is also much taller than the first wave at the nationwide level. The seven-day average of new cases was 133,918 on April 11. This is 1.4 times the weekly average of 93,617 India hit on September 16 last year at the peak of the first wave. Is the second
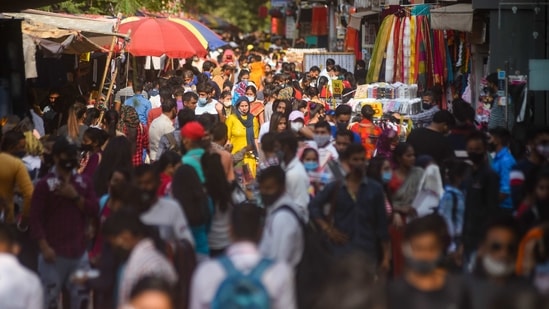
Visitors flout social distancing norms, at Sarojini Nagar market, in New Delhi, India, on Monday, April 12, 2021. (Photo by Amal KS/ Hindustan Times)
Low testing hiding the true scale of the second wave
The weekly average of positivity rate of Covid-19 testing in India reached an all-time low of 1.47% on February 13. It has climbed steeply since. The average was 10.7% on April 11. It has been higher than this only on 13 days prior to April 11: from July 19 to July 29, and on August 2 and August 3, when testing was yet to reach its fullest capacity in the country. The World Health Organization (WHO) considers a positivity rate of 5% to be the threshold for considering the Covid-19 epidemic as under control. One of the reasons for this is that a low positivity rate of tests implies that most infected people have been identified and isolated, and cannot spread the infection further. India’s high positivity rate of tests underlines the severity of the second wave in India. It also suggests that there might be several more Covid-19 cases that have not been identified.
Eighteen states/UTs that need to ramp up testing
The scale of the second wave compared to the first is not a sufficient metric to measure how bad the current surge is; for that, positivity rates need also be considered. At the state level, for instance, of the nine states and UTs where the second wave has overtaken the first one, only Gujarat and Uttar Pradesh registered an average positivity rate lower than 5% in the week ending April 11. Of the remaining 25 states and UTs for which testing numbers are available (numbers not available only for Ladakh, Dadra and Nagar Haveli and Daman and Diu), almost half (11 states/UTs) have a positivity rate greater than 5%. Clearly, these 11 regions also cannot be complacent just because their second wave is so far smaller than the first one – they need to increase testing.
In six of the nine states/UTs with a second wave bigger than the first (the exclusions are Gujarat, Madhya Pradesh, and Haryana), the average number of tests in the week ending April 11 was the highest ever, suggesting that there has been an effort to increase testing. Among the 11 states, where the current average of cases is still lower than their previous peak, only Delhi has increased testing (to its highest level).
Abhishek Jha is Assistant Editor-Data at Hindustan Times. He uses statistical programming to generate newsworthy insights from large datasets. He is part of the team that produces Number Theory, a daily data story feature of the paper’s print edition. Since March 2024, he has been writing Weather Bee, a weekly column for the Hindustan Times website. He is a chemical engineer by training, who specialises in stories related to weather, climate, and the environment. Jha has been at HT since 2018, where he offers data-driven perspective and analysis on politics, environment, weather, climate, economy and society. His work includes data coverage of elections in India and abroad, including the 2019 and 2024 Lok Sabha elections; the disasters and extreme weather resulting from changing climate, such as floods, droughts, heat waves, cold waves, and dwindling snow cap in the Himalayas; the factors that drive poor air quality in northern India; the changing patterns of land use; the Covid-19 pandemic and its impact on labour market conditions; the changing pattern of consumer spending seen in the new consumer spending surveys; and social norms seen in the surveys such as the National Family Health Survey.
Get Latest News, breaking headlines, and top India News, and today real-time updates from across the nation. Stay informed on politics, government policies, crime, Today Weather, and major developments on Hindustan Times
Get Latest News, breaking headlines, and top India News, and today real-time updates from across the nation. Stay informed on politics, government policies, crime, Today Weather, and major developments on Hindustan Times