With cases of Covid-19 rising at an alarming rate in Mumbai in the past few weeks, questions emerge if it is headed on a trajectory not too different to what New York City followed as it became the pandemic hotbed in the United States.
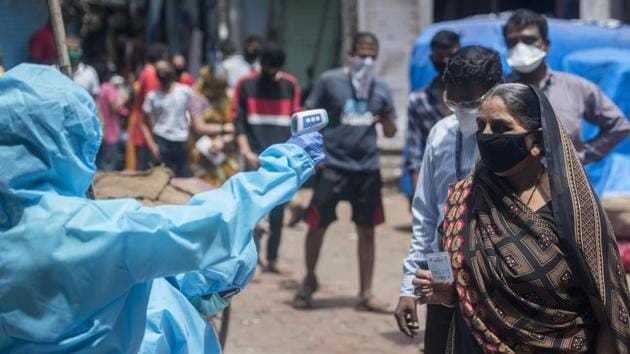
Both are the worst-hit cities in their respective countries.
Here is a look at numbers to see if the spread of the Sars-CoV-2 virus in Mumbai can flare like it has in New York.
Difference of demography

Mumbai is roughly half the size of New York City and has more than 1.5 times the population, according to numbers by the 2011 census in India and 2010 census in the US. This means that on average, India’s financial capital has more than three times as many people living in every square kilometre compared to the Big Apple.
Also crucial is the presence of ultra high population areas in Mumbai like Asia’s largest urban slum, Dharavi, which has seen 1,327 cases and 56 deaths due to Covid-19. All of this places Mumbai at a massive disadvantage as the congestion makes it far easier for the virus to spread.
Spike vs gradual rise
{{/usCountry}}Spike vs gradual rise
{{/usCountry}} 
In absolute numbers, New York City has reported more than nine times the cases and 270 the number of deaths than Mumbai. For uniform comparison, the starting point is the first day each city reported over 50 cases. New York saw a very steep rise off the start and only 15 day in, it had a gap of nearly 15,000 cases over Mumbai. However, a drop in new cases towards the middle of March brought the NYC curve down.
The trajectory followed by Mumbai is more even with a gradual increase of cases. However, unlike the drop seen in NYC’s curve, Mumbai’s remains rising at a steady rate.
‘Flat’ vs ‘rising’

For our analysis, we have plotted a five-day average line over the daily new cases to how a clear trend. We see that while the trend line is rising rapidly in Mumbai in the last 60 days, in NYC, it appears to have weathered the worst of the storm. New cases in NYC are now consistently getting ;ower than the peak seena t the start of April.
(Source: HT’s Covid-19 dashboard and Johns Hopkins University)
Stay updated with all the Breaking News and Latest News from Mumbai. Click here for comprehensive coverage of top Cities including Bengaluru, Delhi, Hyderabad, and more across India along with Stay informed on the latest happenings in World News.
Stay updated with all the Breaking News and Latest News from Mumbai. Click here for comprehensive coverage of top Cities including Bengaluru, Delhi, Hyderabad, and more across India along with Stay informed on the latest happenings in World News.