Many of the city’s air quality stations going dark on Diwali night does not help in answering this question consistently. And the warmer night perhaps helped despite firecrackers being used well beyond prescribed limits. The air, despite relatively favourable weather, is still close to the 'severe category' – the threshold for pollution reaching its most harmful levels.
More than half the stations went dark, over 80% functioning in “severe” range
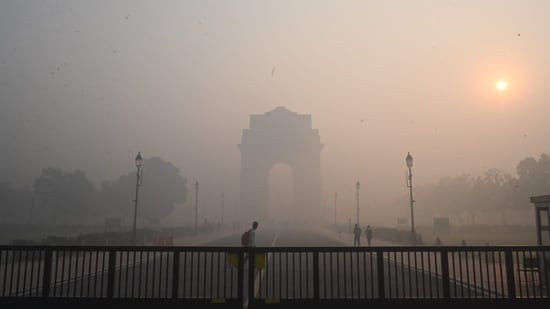
A consistent comparison of Diwali air pollution requires comparable data over time. More than half the air quality stations in the national Capital stopped reporting air quality data around midnight. This happened even as the stations that continued to report data found the air “severe” or with the Air Quality Index (AQI) above 400. Around 80% of functioning stations were reporting air in the “severe” range from the hour starting 10pm on Diwali to the hour ending 6am on the morning after. At 9 pm, on Diwali night, the latest reading after which the number of reporting stations fell sharply, 61% of the reporting 57 stations had an AQI of 400 or more.
To be sure, AQI is generally calculated by calculating sub-indices for multiple pollutants and choosing the highest sub-index as the AQI. HT has limited itself to the PM2.5 sub-index throughout this analysis to look at the widest range of stations across years.
Deep Dive
How did Delhi’s Diwali pollution compare with previous years?
Why is it difficult to compare Delhi’s Diwali pollution across years?
How did the weather affect Delhi’s Diwali air pollution?
The third worst Diwali night since at least 2021
While data gaps make comparison across years difficult (the stations that go dark are not necessarily the same every year), HT has overcome this problem by looking at six stations that have reported data for most of Diwali’s peak hours in all years since 2021: Alipur, Aya Nagar, Bawana, IHBAS-Dilshad Garden, Narela, and Punjabi Bagh. Going further back reduces the number of stations further. The average of these six stations shows that Delhi’s air has been the third most polluted for most hours since Diwali night. The peak PM2.5 sub-index at these stations averaged 655 – recorded at the hour ending 1am in the early morning after Diwali. The only higher peak pollution – in terms of hourly averages – was recorded in 2021 and 2025, when these values were 812 and 752. The number was much lower in the 2022-2024 period, when the peak was 483,583, and 489. To be sure, there are two hours after the peak – the hour ending 4am and 5am – when pollution this year was the second highest after 2021. However, that is possible because of gaps in data which is available. The stations were selected if they had data for at least 9 hours in the period starting 6pm on Diwali and ending at 6am the morning after.
{{/usCountry}}While data gaps make comparison across years difficult (the stations that go dark are not necessarily the same every year), HT has overcome this problem by looking at six stations that have reported data for most of Diwali’s peak hours in all years since 2021: Alipur, Aya Nagar, Bawana, IHBAS-Dilshad Garden, Narela, and Punjabi Bagh. Going further back reduces the number of stations further. The average of these six stations shows that Delhi’s air has been the third most polluted for most hours since Diwali night. The peak PM2.5 sub-index at these stations averaged 655 – recorded at the hour ending 1am in the early morning after Diwali. The only higher peak pollution – in terms of hourly averages – was recorded in 2021 and 2025, when these values were 812 and 752. The number was much lower in the 2022-2024 period, when the peak was 483,583, and 489. To be sure, there are two hours after the peak – the hour ending 4am and 5am – when pollution this year was the second highest after 2021. However, that is possible because of gaps in data which is available. The stations were selected if they had data for at least 9 hours in the period starting 6pm on Diwali and ending at 6am the morning after.
{{/usCountry}}Favourable weather likely helped bring Diwali peak down this year
As the previous chart shows, Diwali started off much worse than it ended. Up to the hour starting 7am on November 8, Delhi’s air averaged the worst since 2021. It was the second worst even up to the hour starting 7pm. It is only after that hour that 2026 air is ranked the third most polluted. This can happen in largely two ways: somewhat fewer firecrackers being burst this year or weather turning more favourable. The latter is the more likely answer. Meteorological Aerodrome Report (METAR) data from Palam – collated by Iowa State University – shows that this has been the third to fourth warmest Diwali since 2021 across different hours of Diwali. In some hours, it was also almost as windy as 2022-2024, some of the relatively cleaner Diwali years. This would have helped in clearing some pollutants. In other words, without help from meteorological factors, this could have been an even more polluted morning after Diwali.