
 E-Paper



Pilgrimage and numbers: What data says about Kanwar Yatra | Number Theory
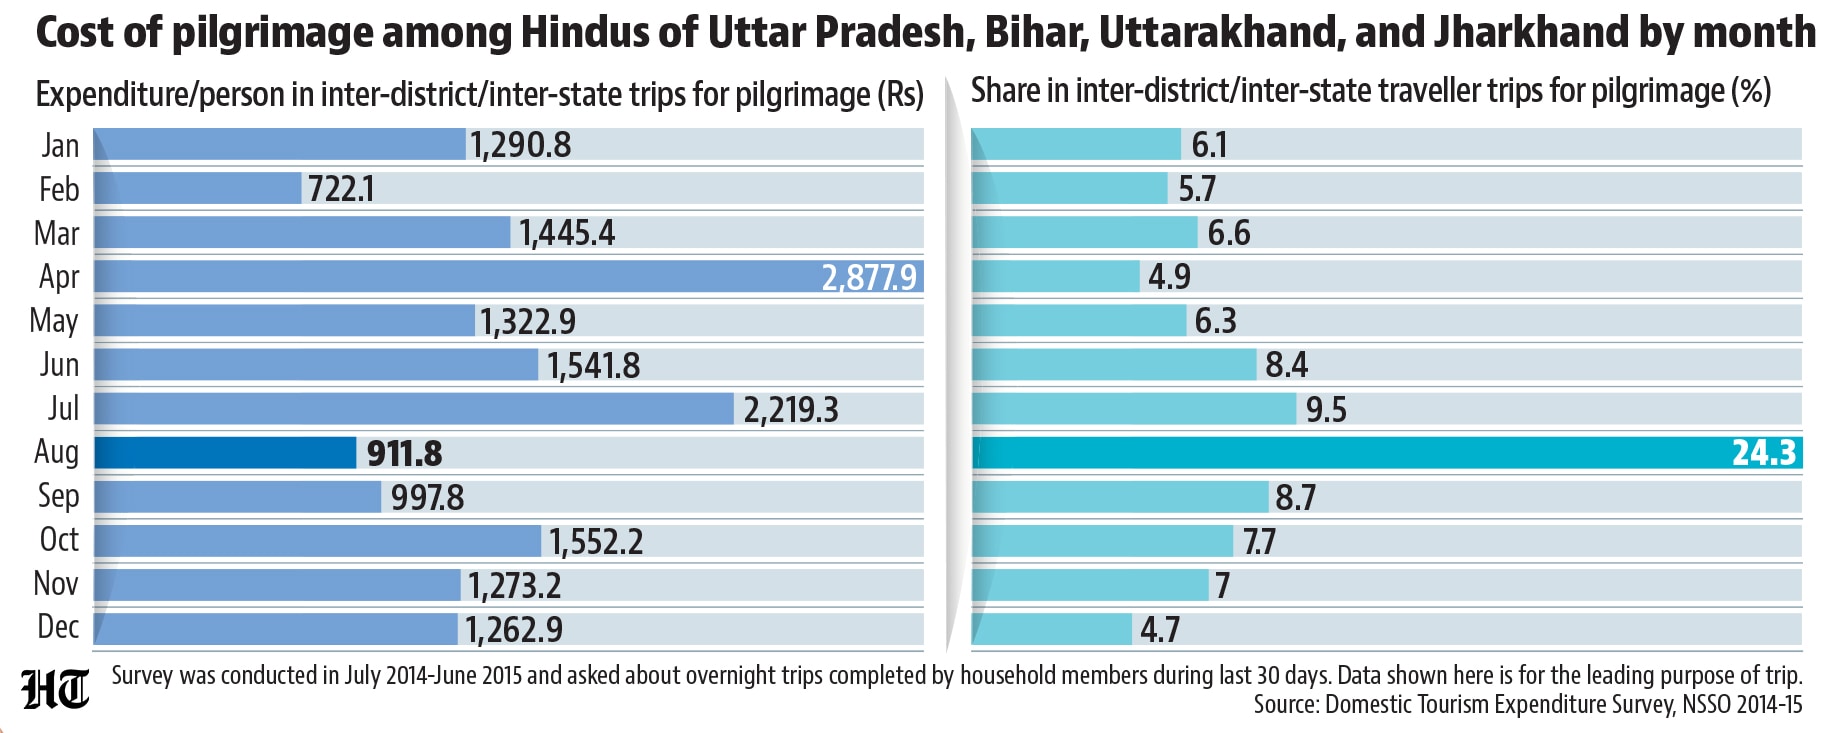
The average inter-state or inter-district pilgrimage spending in August in the survey is ₹912 per person compared to ₹1,501 in other months for Hindus.
Published on: Aug 10, 2026, 06:38:12 IST

 Prefer HTon Google
Share via


Copy link

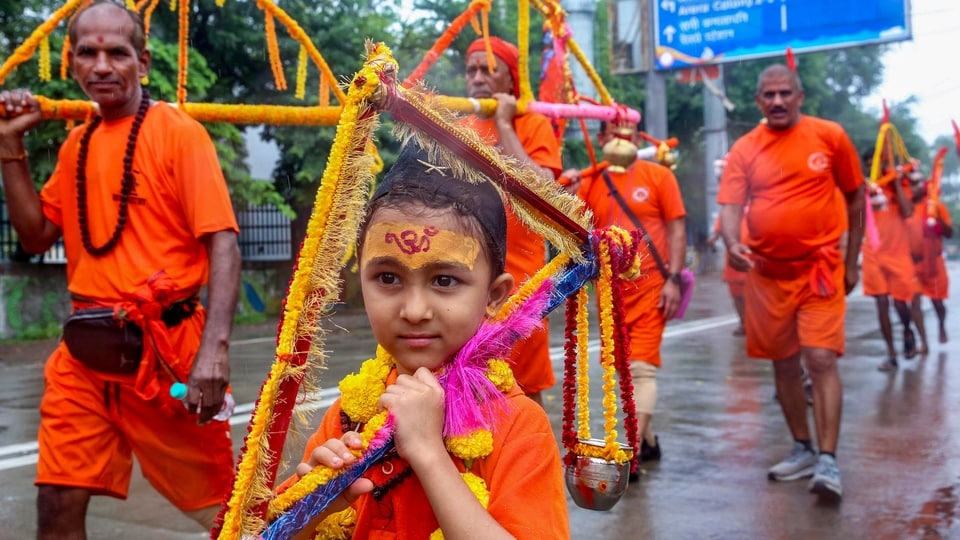
The Kanwar Yatra is one of the longest and most public forms of religiosity seen in the Hindi-speaking states of the Gangetic plains. The pilgrimage, which takes place in the Hindu month of Shrawan and is currently underway, lasts for a few weeks and often creates news for reasons that are far removed from religion. The ritual seems to be attracting more people every year, along with the seasonal philanthropy which emerges along its route. Is it possible to capture all of this quantitatively? Two government surveys – one on domestic tourism and another one time use – can help us do that.
Pilgrimage and numbers: What data says about Kanwar Yatra
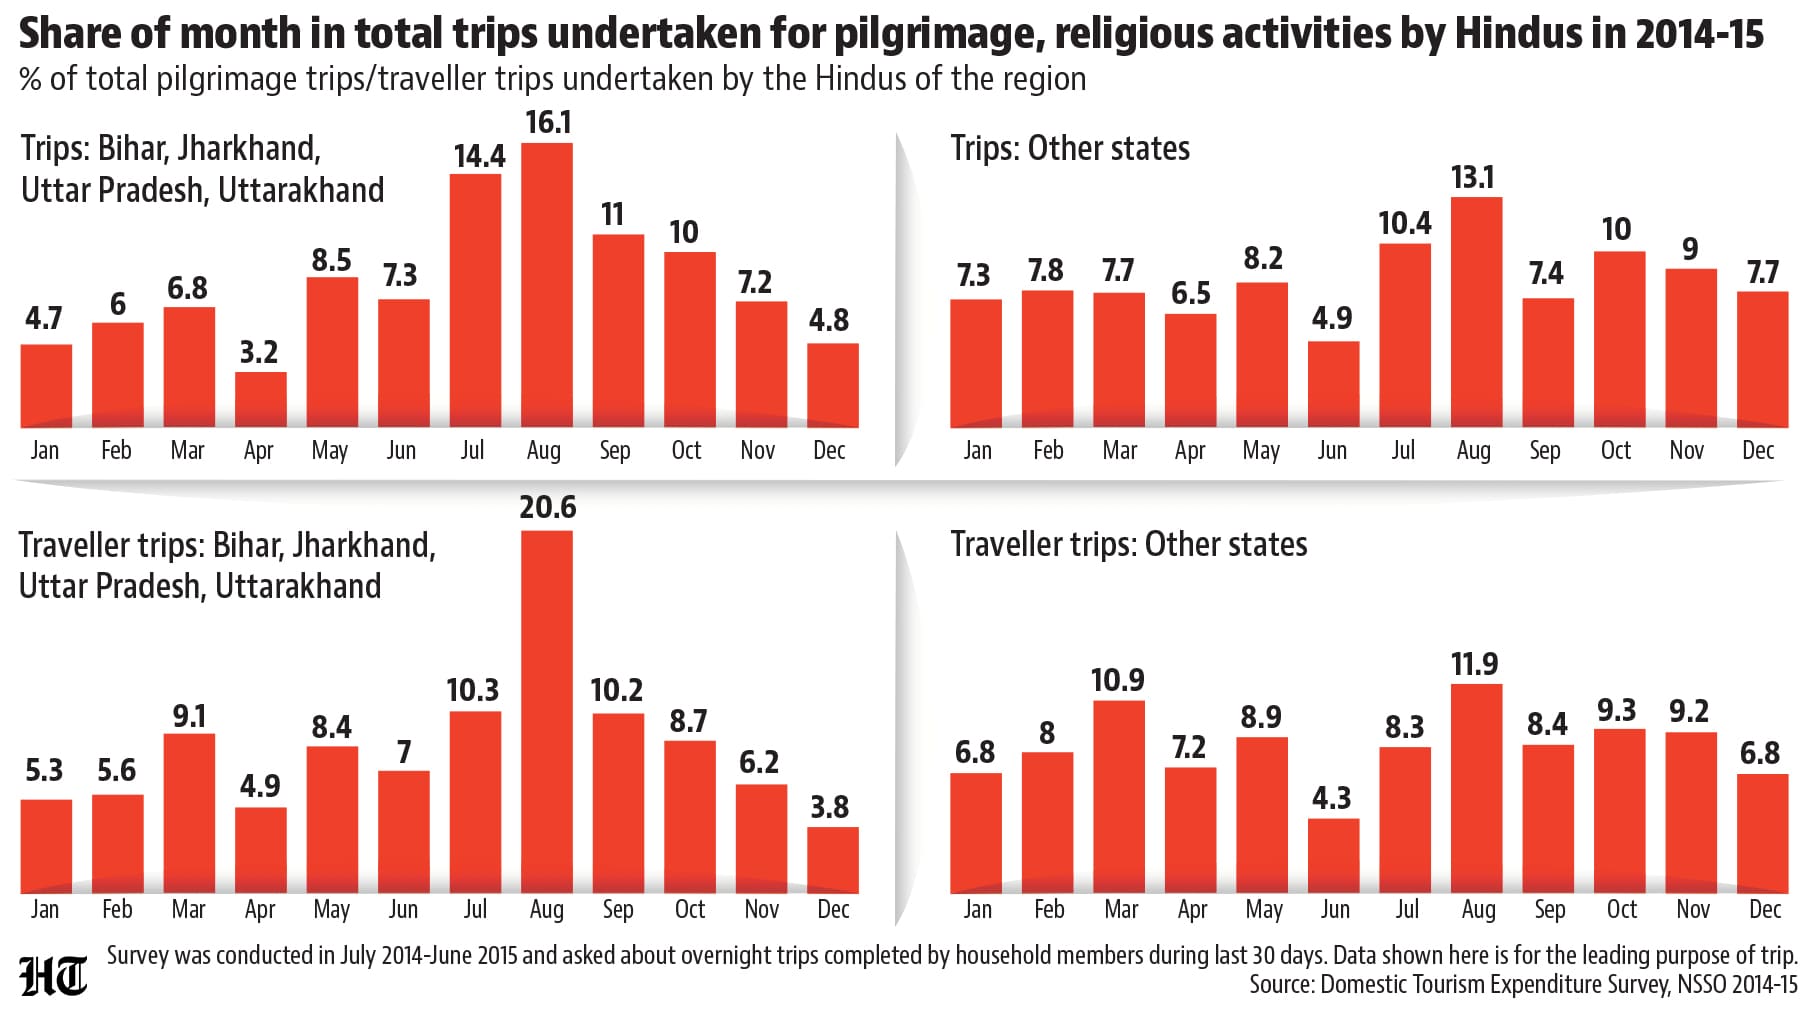
 How important is the Kanwar Yatra among religious trips in India?The last domestic tourism survey was conducted in July 2014-June 2015 and is now a decade old. However, it can offer at least a directional sense of the popularity of the Kanwar Yatra relative to other kinds of pilgrimages. The survey asked households if any member had undertaken an overnight trip (a trip not made regularly, lasting at least 12 hours and including the period between midnight and 5 am) in the 30/365 days preceding the survey. Pilgrimages were surveyed in the 30-day recall period, along with trips undertaken for business, social, or education and training purposes. In the year of the survey, Shrawan was observed from July 13 to August 10, and Hindus reported a peak of pilgrimage trips in August that was not seen for other three categories. A large part of this might simply have to do with the population weight of the four states through which the Kanwar Yatra routes run: Bihar, Jharkhand, Uttar Pradesh and Uttarakhand. The August peak is far more clearly defined in these states and less so in other states, especially in terms of traveller-trips, which is the number of trips multiplied by the number of members travelling.
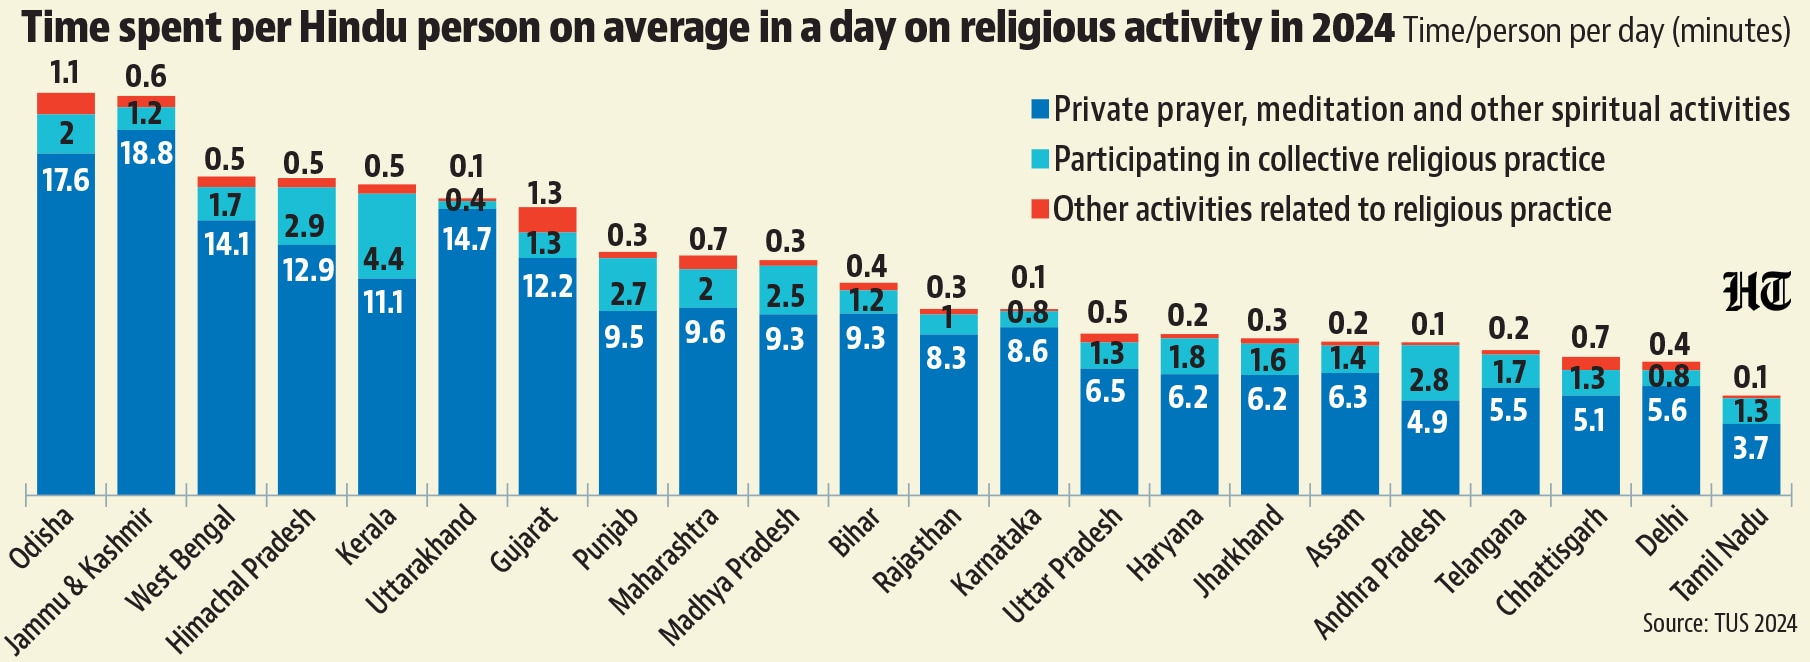
- Public display of religiosity does not mean kanwariya states are more religious in daily lifeThe scale of the Shrawan pilgrimage and its visible impact on everyday life along the routes does not mean that Hindus in states that are more likely to send kanwariyas are more religious. The average Bihari Hindu spends 10.9 minutes per day in religious activity according to the 2024 Time Use Survey, the same as the average Indian Hindu. Hindus in Uttar Pradesh and Jharkhand spend a couple of minutes less. While Uttarakhand Hindus do rank on the higher end, they still spend about five minutes less than the Hindus in Odisha, who rank highest. More importantly, in all states, almost all of the time is spent on private prayer rather than in collective religious practices. This squares with anecdotal and qualitative explanations of the Kanwar Yatra, which attribute its popularity also to factors beyond religious practice.
- What also helps is the social subsidy on the pilgrimageCome Kanwariya season, a large number of camps come up to cater to the needs of pilgrims. This entails a degree of social subsidisation of the entire endeavour, thereby reducing the need for private spending by the person undertaking it. Even this shows up in the government data on domestic tourism cited above. The average inter-state or inter-district pilgrimage spending in August in the survey is ₹912 per person compared to ₹1,501 in other months for Hindus of the four states.
- FootnoteOnce the new domestic tourism survey is published -- it was conducted between July 2025-June 2026 -- we will know more about these trends, which perhaps have only become stronger.


Unlock a world of Benefits with HT! From insightful newsletters to real-time news alerts and a personalized news feed – it's all here, just a click away! -Login Now!


