
 E-Paper



Skewed July rainfall trims the monsoon deficit | Number Theory
The six days of July have helped offset some of the rain deficit accumulated in June.
Updated on: Jul 7, 2026, 07:52:51 IST

 Prefer HTon Google
Share via


Copy link

The southwest monsoon, which runs from June to September, arrives over most of the country in June. But July is a relatively more important month in terms of the cumulative performance of rainfall in the season. This is because it is usually the rainiest month of the season. How is monsoon performance in the first week of the month? The six days of July have helped offset some of the rain deficit accumulated in June. However, an HT analysis of the gridded data of the India Meteorological Department (IMD) shows an uneven distribution. Here are four charts that show how.

Skewed July rainfall trims the monsoon deficit
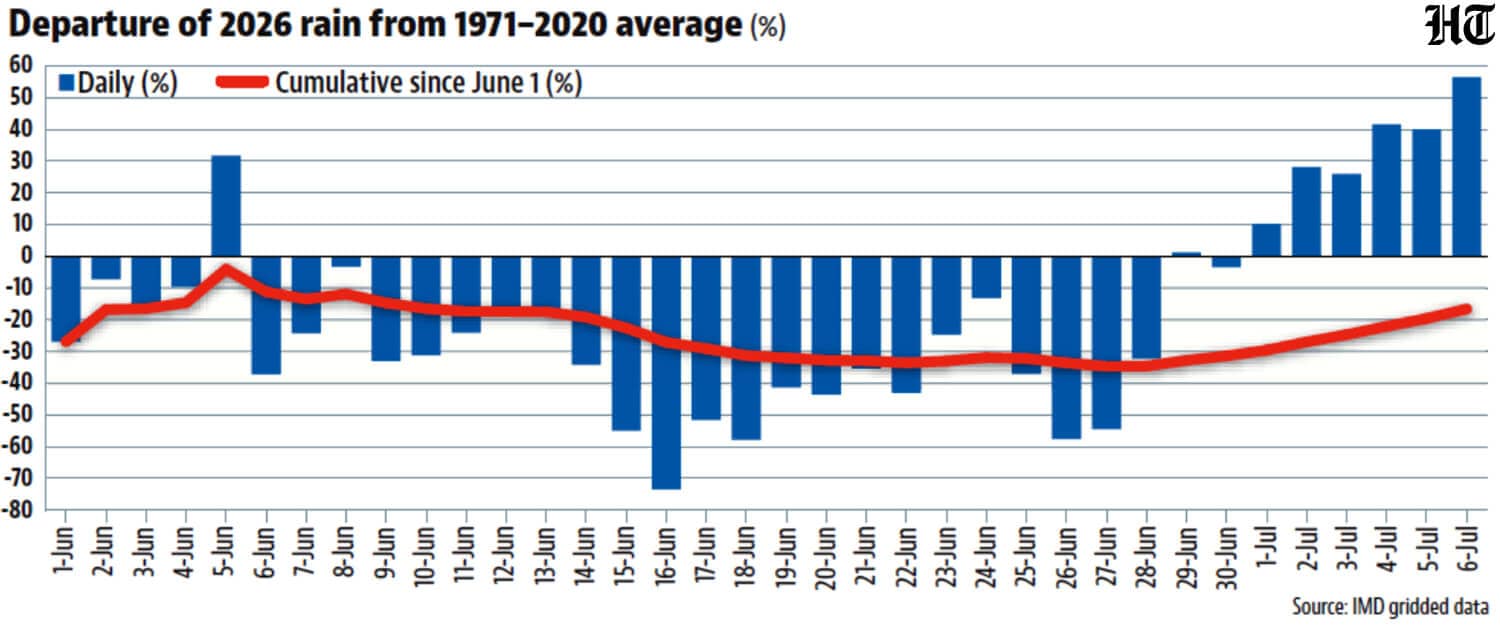
- The first six days of July are the 23rd rainiest since 1901India has received 65.3 mm rain in the July 1-July 6 period, which is almost 60% of the rain India got in June. Some of this is because of a big deficit in June, but July is indeed wetter than usual. This is the 23rd wettest July 1-July 6 period since 1901 and the rain this year is 49% more than the 1971-2020 average, which IMD currently considers as the Long Period Average (LPA) for tracking rainfall performance.
 July’s surplus has helped decrease the deficit in cumulative monsoon rainThe large surplus in July – all six days have recorded a surplus so far -- has also decreased the cumulative deficit in monsoon rain: from 31.4% at end of June to just 17% now. To be sure, this is still the 22nd driest monsoon since 1901. Another caveat to be read with these numbers is that IMD’s published statistics – they use a somewhat different set of stations for calculating average rain for India than the gridded data – differ from the statistics generated from the gridded data, although both point to similar trends. For example, IMD’s published statistics put the cumulative deficit on July 6 at 20%, although the time series chart of cumulative deficit this season follows the same pattern in both datasets.
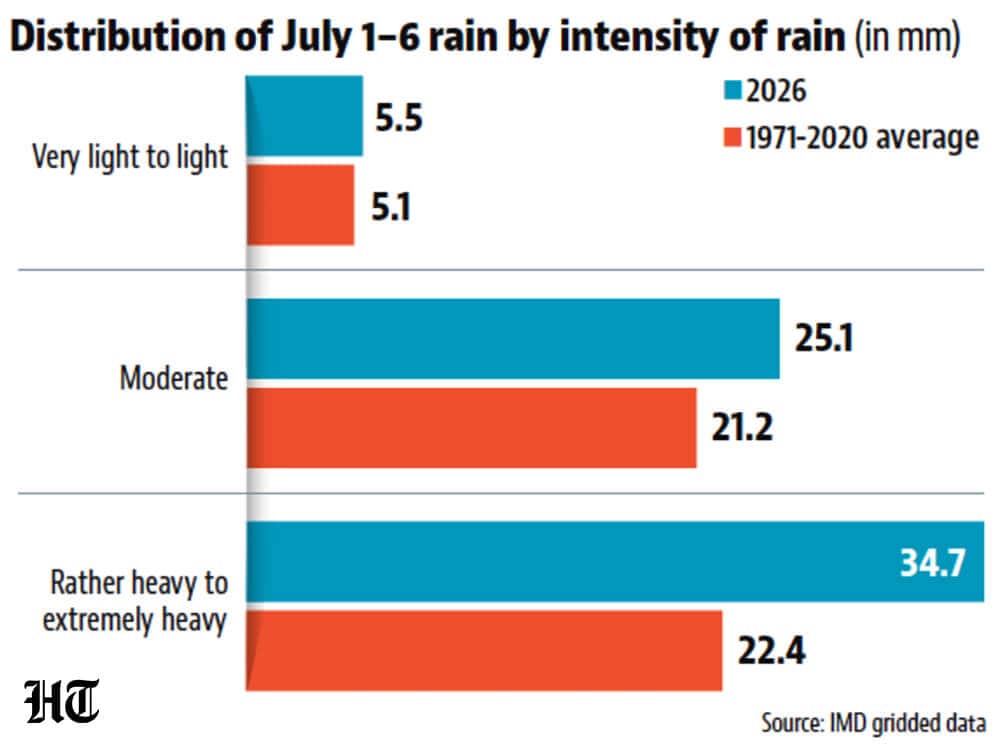
- But July surplus is built on high intensity rainIMD classifies rain up to 7.5 mm in 24 hours as light rain, 7.6-35.5 mm rain as moderate, 35.6-244.4 mm rain as different categories of heavy rain, and more than 244.4 mm rain as extremely heavy rain. Averaging rain of different intensities for India in July shows that the surplus in higher intensities of rain is more than that in lower intensities. For example, light intensity rain has a 7.6% surplus, moderate intensity rain has 18.3% surplus, but higher categories than moderate intensity have a 55% surplus. This explains some of the disasters unfolding in urban centres like Mumbai, with urban infrastructure failing to keep up with intense rain.
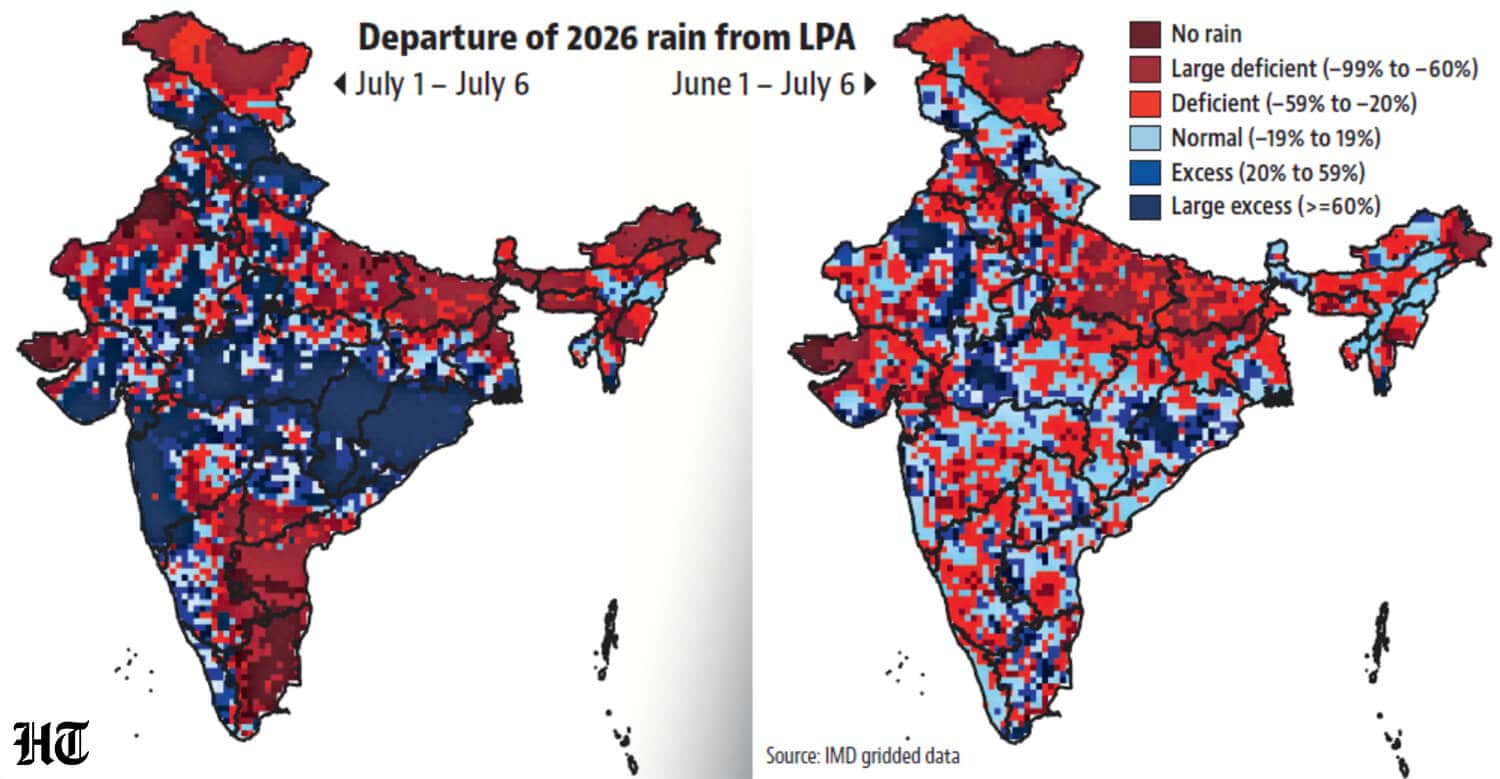
- This means that July surplus is also geographically skewed so farAll days of July have had a surplus so far, but not all parts of India. 46% of the country, for example, has a deficit of 20% or more. On the other hand, a relatively smaller area -- 40% of the country’s area -- has a surplus of 20% or more. This means a large surplus in a relatively smaller area is offsetting the deficit of the rest of the country. This region is concentrated the most in the region along the west coast, the Vidarbha region in Maharashtra, and almost all of Madhya Pradesh, Odisha, Chhattisgarh, Himachal Pradesh, and Uttarakhand. To be sure, the July skew has helped decrease the overall skew in monsoon rain. Area under normal rain has increased from 19.6% of India’s area at the end of June to 30.8% by July 6.


Unlock a world of Benefits with HT! From insightful newsletters to real-time news alerts and a personalized news feed – it's all here, just a click away! -Login Now!


