Both methods have real merit. For anyone investing alongside a full-time career, the question is which of the two can be learnt and used with the hours they actually have.
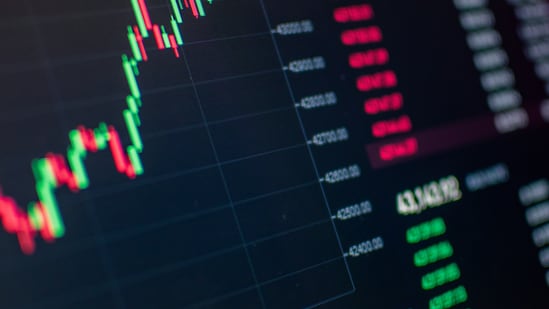
Two ways of deciding what to buy have been arguing with each other for as long as markets have existed. Fundamental analysis studies the business itself: What it earns, what it owes, how good the management is, how strong its position is against the competition, and what all of that says the company is worth. Technical analysis studies the price chart: how the stock has actually been traded, and what the price and the volume behind it say about what market participants are doing with it.
The argument between them is usually about accuracy. Which method describes a company more truthfully? But for ordinary working people, a second question matters more. Which of the two can they actually learn and apply with the hours they have?
That question is worth asking now because the ground has shifted. Not long ago, charts were dismissed as astrology. Over the last decade, chart-based traders have won real-money investing championships, with audited, triple-digit annual returns, year after year. Whether technical analysis works is no longer the question. The question is which of the two suits an ordinary working person better.
{{/usCountry}}That question is worth asking now because the ground has shifted. Not long ago, charts were dismissed as astrology. Over the last decade, chart-based traders have won real-money investing championships, with audited, triple-digit annual returns, year after year. Whether technical analysis works is no longer the question. The question is which of the two suits an ordinary working person better.
{{/usCountry}}The practical comparison comes down to four points.
First is, what each method asks of you. There is no end to fundamental analysis. A company can be studied forever, and there is always more to know. The annual reports. The concall transcripts. The supply chain. The competition. The quality of the management. And someone else will always know more than you do, usually because they have better access to the business.
Fundamental work also asks for deep domain knowledge and years of tracking an industry. Then come the long waits. The price does nothing for months, and there is no way to tell whether you are early or simply wrong.
This is not a beginner's problem alone. Even people trained to read financial statements, including chartered accountants, will admit that studying one company in full still leaves gaps. There are too many things to evaluate. Several of them cannot be verified from outside the company at all.
There is also the arithmetic of time. Detailed fundamental work on two companies can take weeks. A chart-based process can go through an entire market in a couple of hours. For a working professional with a few hours a week to give to the markets, that difference decides what is possible at all.
Technical analysis asks for one thing. Price, and the volume behind it. That is the whole list. There is no end to what you can know about a company. There is an end to what you have to read on a chart.
Second is, value and price. Fundamental research tells you what a business is and what it might be worth. No price chart will ever do that. But what a company is worth and what its stock does next are two different problems.
A stock can stay undervalued for years. A stock can also be overvalued and double from there. Both happen all the time. In each case, the fundamental analyst is right about the business and still makes no money for years.
In technical analysis, no stock is overvalued or undervalued. The price is where the market has decided to put it. And that decision deserves some respect, because price is the one place where insiders, operators, institutions and the public all meet. Whatever they know, they have to buy or sell to act on it. The moment they do, it shows up on the chart.
So the job is to study how the stock has actually been traded over a period. What the volume looked like on those moves. And what that behaviour says about who has been buying.
This is where charts do real work. Large institutions move far more money than everyone else put together, and they cannot do it quietly. Whatever they are doing, buying or selling, leaves a mark on the price and the volume behind it.
Reading that mark is the edge. In most large moves, informed money ends up on the profitable side, and the crowd ends up on the other. A chart will not tell you who is acting, or why. It tells you which side is doing the heavy lifting, and that is enough to place your own decision alongside them instead of against them.
Third is, the room for interpretation. Two capable analysts can study the same company and reach opposite conclusions. Both will have a solid model behind them. Two experienced chart readers looking at the same uptrend will usually describe it the same way.
The more a method leaves open to interpretation, the more room it leaves for emotion. And emotion is what costs people money in the market.
A chart can also give a binary answer. Buy or stay out. Hold or exit. So the method can be written down, tested and repeated. That is also what makes it teachable. Fundamental conclusions rarely come down to a yes or a no.
Fourth is, entry and exit. Every position is really three decisions. When to buy. When to get out if it goes wrong. When to get out if it goes right. A chart answers all three with a price, and it answers them before any money goes in.
Fundamental research rarely offers that. It builds an argument for owning the company, often a good one, but it does not produce a price at which that argument has failed. And when the stock does go up, nothing in it says how long to hold.
For an ordinary working person, that clarity is the whole point. The plan for buying and selling exists before the money is committed, and nothing has to be decided in the middle of a falling market, which is exactly when deciding is hardest. Only a chart puts that plan on paper in advance.
Charts will not explain why a stock is moving. They will not deliver a profit every month either. Neither does fundamental analysis. Used carelessly, they become a guessing game. That is the version the critics attack, and they are right to.
Used the right way, charts show where the large institutions are committing themselves, and let an ordinary investor take the same side of a move rather than the opposite one. And that reading becomes a system. There is a precise price to enter, a precise price to exit if the trade fails, and another to exit if it works. All of it is settled before any money goes in.
None of this takes anything away from fundamental research. It has its place, and that place belongs to the domain experts who do it full time, with the access, the training and the decades the work demands.
A person with a full-time job cannot compete on that ground. The information will always reach someone else first; the study never ends, and the hours it demands do not fit alongside a career. But that same person can read the chart the institutions leave their footprints on. It asks for a few hours a week, it can be learnt, and it gives a plan that can be followed. Charts are what a working professional should pursue.
(The views expressed are personal)
This article is authored by Afzal Lokhandwala, financial expert, CA and runs Champions Club.