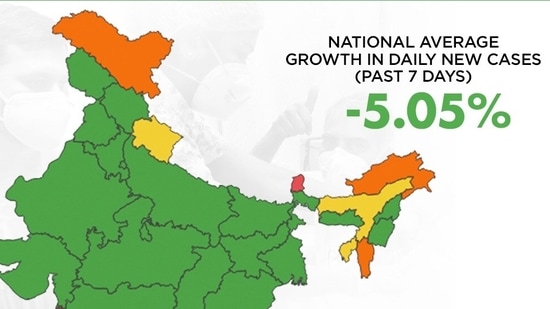
India is witnessing a steady decline in the state-wise average number of new coronavirus disease (Covid-19) cases daily, a map shared by the central government on Twitter has shown. The map, sourced with the help of Union health ministry data from Thursday, shows that the national average growth in daily new cases is currently in the negative, -5.05% to be precise. While a few states, particularly in the northeastern part of the country, are still showing heightened average growth in daily new cases, a major section of the rest of India was seen taking on a 'negative growth' across the same graph.
India's state-wise decline in average daily new Covid-19 cases was shown in a map shared by the central government on Friday through its MyGovIndia portal on Twitter, an official channel meant to update coronavirus-related stats. The data was said to have been sourced from the official figures published by the Union ministry of health and family welfare (MoHFW) on Thursday (June 17).
The map shows that the majority of India, including previous hotspots such as Maharashtra, Tamil Nadu, and national capital Delhi, are now witnessing negative average growth in daily new cases. However, a few select pockets, particularly in the northern and northeast parts of the country are still showing an above-average growth in daily new cases. Uttarakhand in the north, Kerala down south, and Assam and Tripura in the northeast have shown an average growth of 0-10% in daily new cases over the past seven days. Ladakh, Arunachal Pradesh, and Mizoram have witnessed a heightened average growth of 10-20% over the same duration. Only one state, Sikkim, lies in the red zone i.e. an average growth of over 20% in daily new cases during this time.
{{/usCountry}}The map shows that the majority of India, including previous hotspots such as Maharashtra, Tamil Nadu, and national capital Delhi, are now witnessing negative average growth in daily new cases. However, a few select pockets, particularly in the northern and northeast parts of the country are still showing an above-average growth in daily new cases. Uttarakhand in the north, Kerala down south, and Assam and Tripura in the northeast have shown an average growth of 0-10% in daily new cases over the past seven days. Ladakh, Arunachal Pradesh, and Mizoram have witnessed a heightened average growth of 10-20% over the same duration. Only one state, Sikkim, lies in the red zone i.e. an average growth of over 20% in daily new cases during this time.
{{/usCountry}}India's Covid-19 figures were colour-coded on the infographic, state-wise, according to its average growth in daily new cases over the past seven days, i.e. from June 10-17. While green signifies a 'negative growth' benchmark -- a trend seen across a major section of India -- other colours show heightened average growth. Yellow, orange and red signify an average growth in daily new cases of 0-10%, 10-20%, and more than 20%, respectively, over the preceding seven days.