
 E-Paper


Covid-19: Vaccine inequality across districts is high, but it is decreasing
The first part of this two-part data journalism series built alternative estimates of India’s adult population across districts by using the 2019 electoral roll.
Is there vaccine inequality across districts? This analysis has been constrained by the non-availability of population data by districts. Such numbers are only available in census figures, which are now ten years old.
")
The first part of this two-part data journalism series built alternative estimates of India’s adult population across districts by using the 2019 electoral roll. The second and concluding part will track vaccine inequality as a dynamic variable across districts and try and understand how it has evolved over the course of India’s Covid-19 vaccination programme. It will also try and chart out the possible trajectory going forward.
Inequality was increasing across districts until June, but it is coming down now
The best way to measure inter-district vaccine inequality is by looking at the gap between districts which have performed well and those which have not. Individual comparisons, such as the gap between best and worst districts, can be misleading here. This is because such districts can be outliers. HT has looked the share of vaccinated population by classifying all districts into quartiles (from bottom 25% to top 25%) for each day of vaccination.
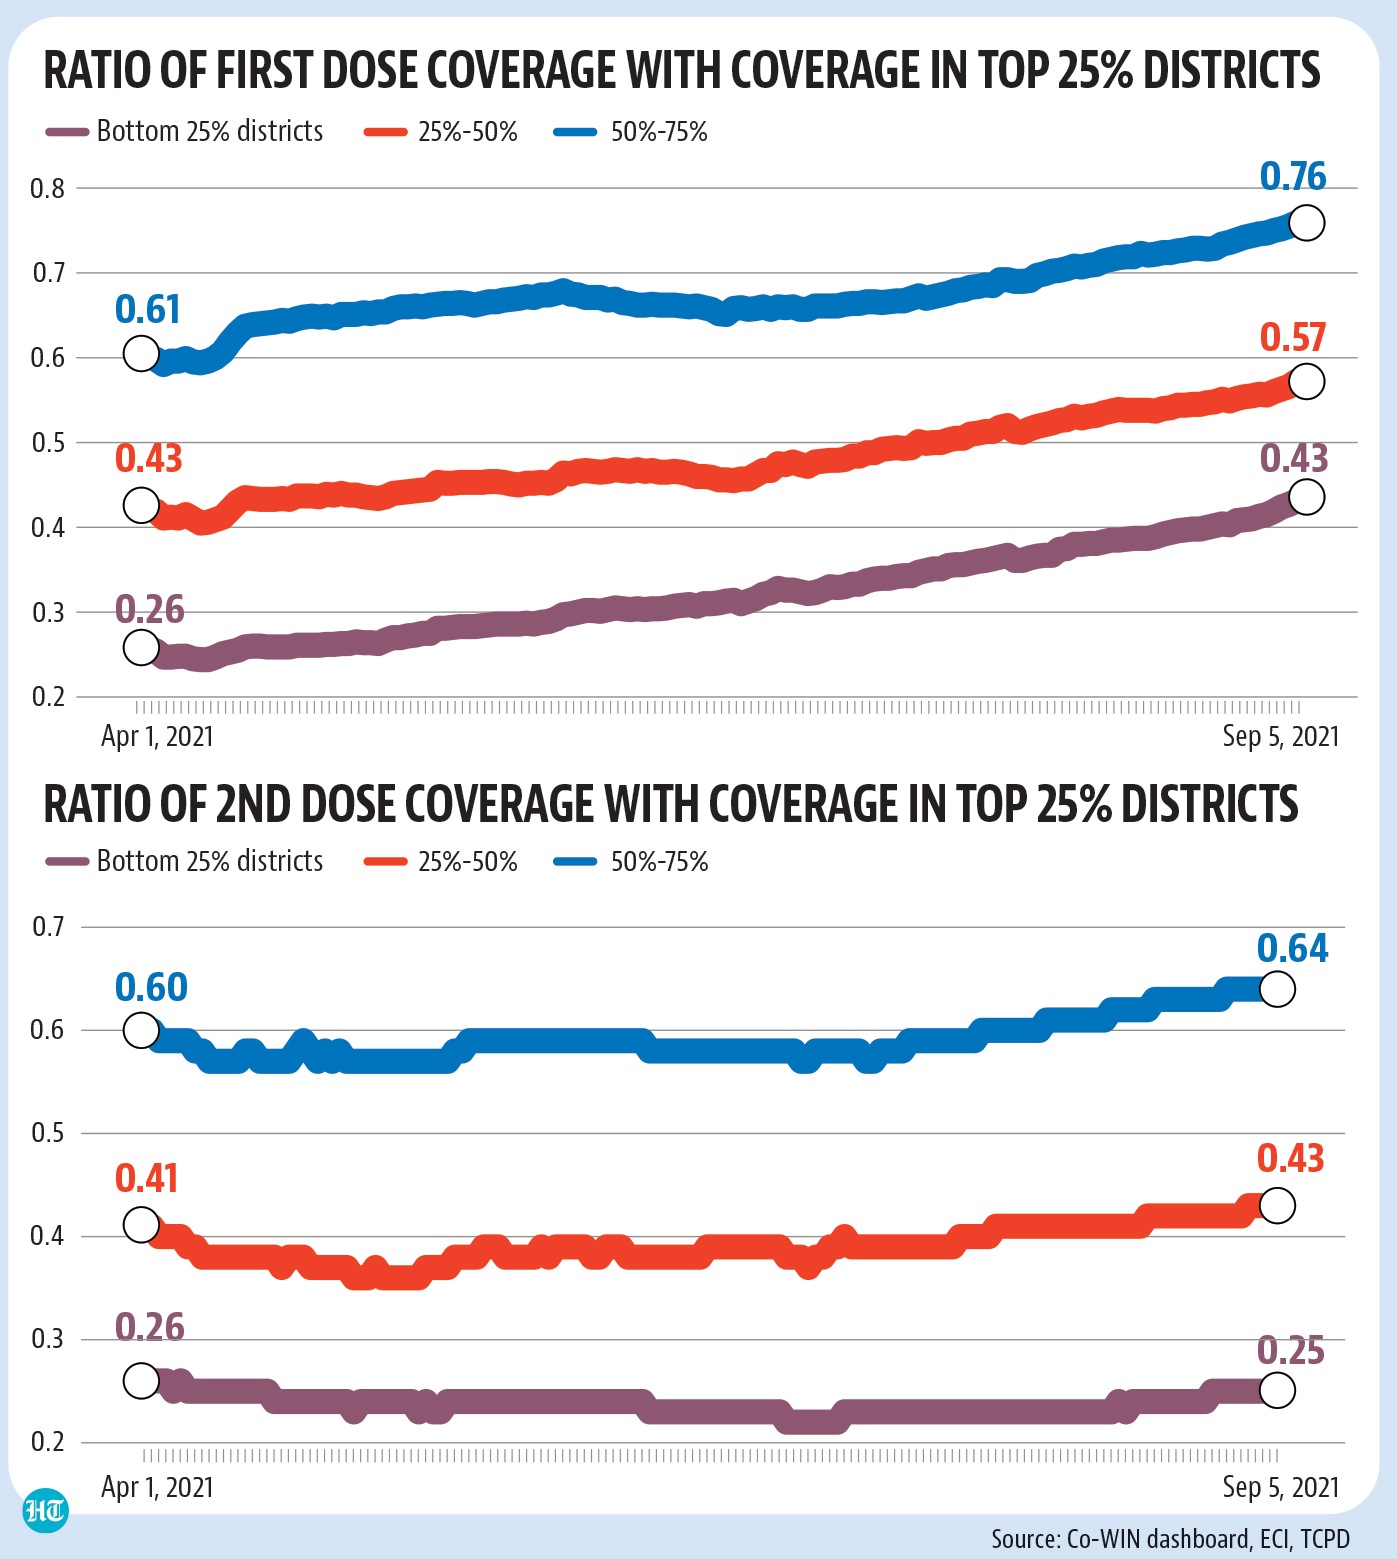
The comparison shows that inter-district vaccine inequality in terms of share of vaccinated population with at least one dose has almost continuously decreased. This comparison starts from April 1, which is when India opened vaccination for everyone over the age of 45. First dose coverage in the bottom three quartiles has almost consistently caught up with the coverage in the top 25% districts. The coverage in bottom 25% districts was 26% of the coverage in top 25% districts on April 1 and is now 43% of the coverage in the top 25% districts.
The inequality in second doses has decreased less consistently than for first doses. On April 1, coverage in the bottom three quartiles was at 25.76%, 40.53%, and 59.82% of the coverage in the top quartile. This gap increased for the bottom three quartiles at different rates initially. From July 2, inter-district vaccine inequality started coming down for all three bottom quartiles for the population which has received both doses as well.
Weight for laggard districts in overall population is higher
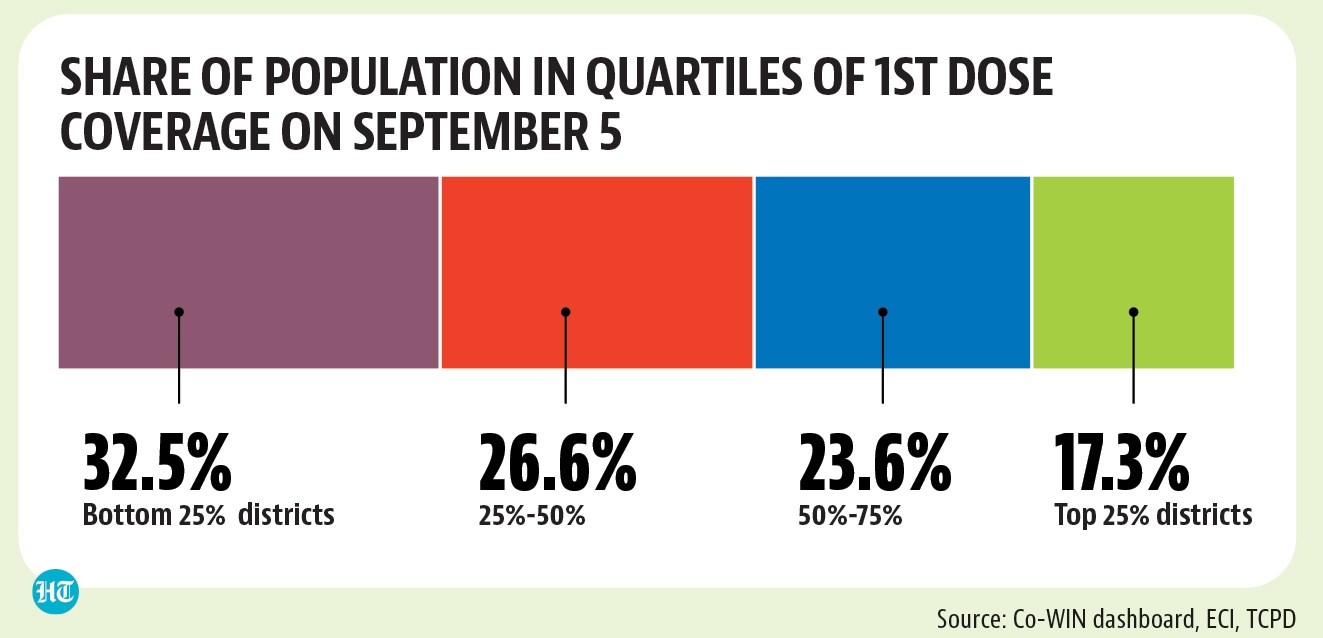
While declining inequality is a welcome development, it is still quite high. What makes the challenge even more important is the fact that laggard districts have a bigger share of population than their top-performing counterparts. For example, the bottom 25% of districts (in terms of first dose coverage as on September 5) had a share of 32.5% of the total adult population. This number was just 17.3% in the top 25% of districts. The same trend holds as far as median vaccination coverage is concerned. Districts below the median mark have 59% of the country’s adult population.
Have districts pulled up or slipped down drastically?
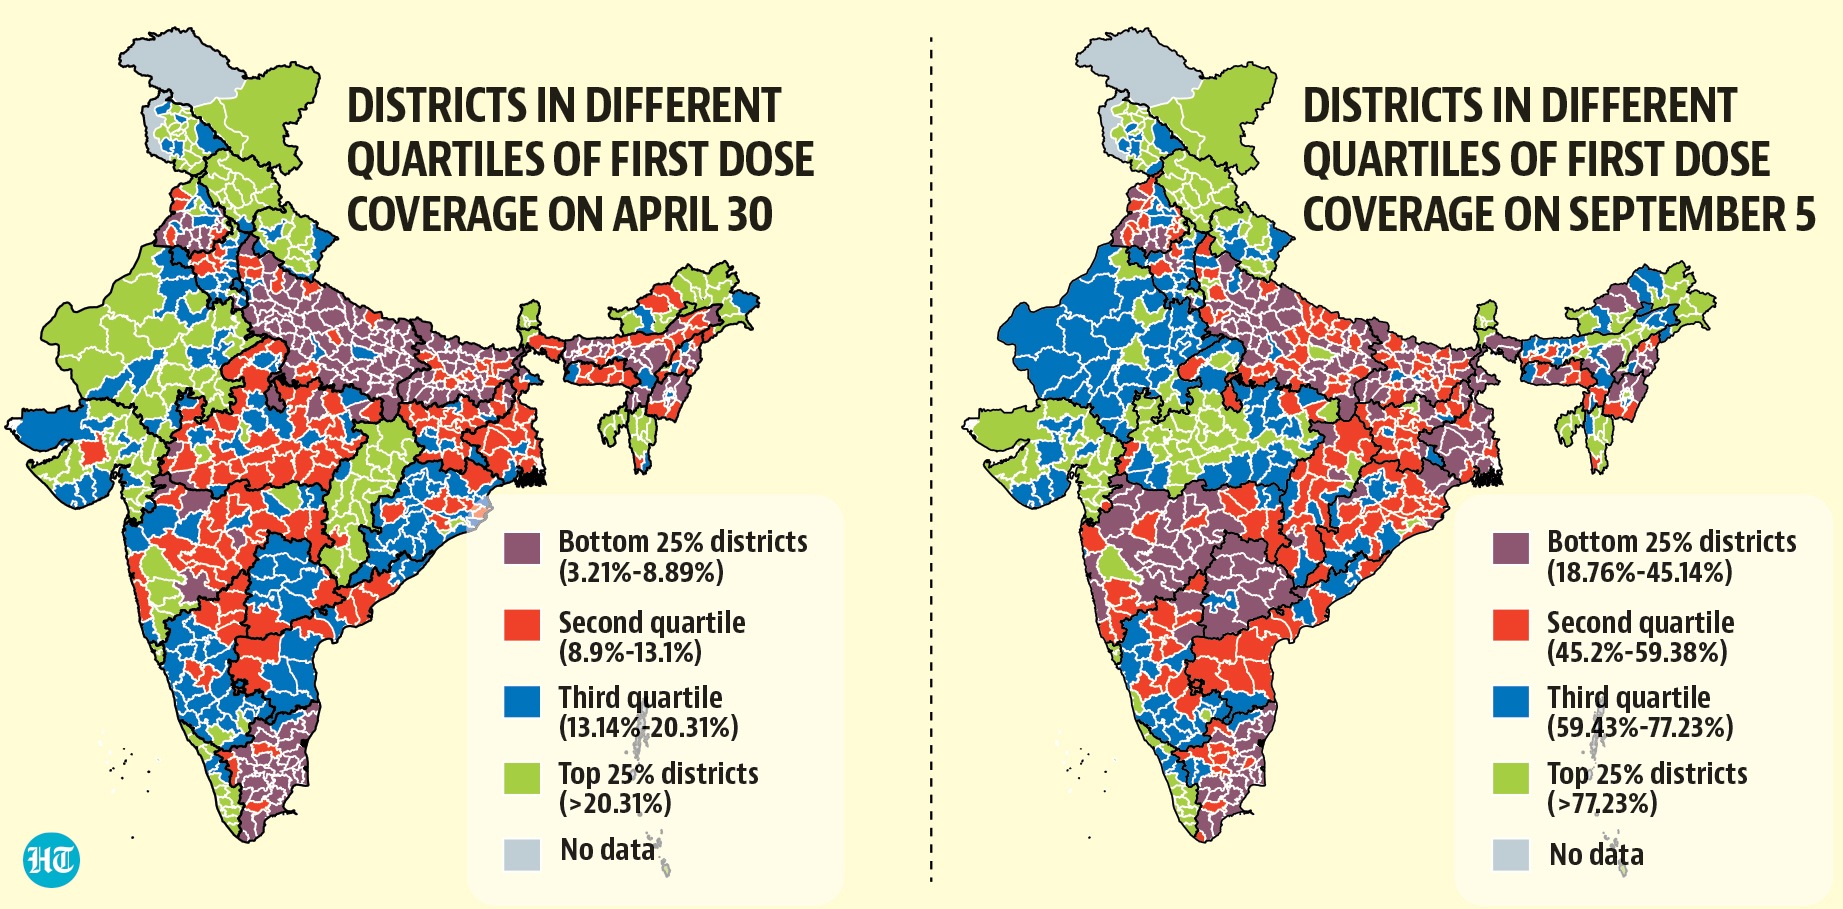
Have districts performing badly in the initial phase of vaccination shown a drastic improvement and vice versa? This is a possibility, theoretically speaking. Our analysis shows that this not very likely. Of the 157 districts which have been in the bottom quartile (by share of population which has received at least one dose), only two (Morigaon and Lakhimpur in Assam) have managed to make it to the top quartile so far. The reverse also holds true. Only two districts (Janjgir Champa and Koriya in Chhattisgarh) among the 157 districts which have been in the top quartile have fallen to the bottom quartile.
In coverage of first doses, 336 of 628 districts were in the same quartile on September 5 as they were on April 30 (a month after vaccination was opened up for all adults). Among the rest of the districts, 232 have jumped only one quartile (112 going up; and 120 going down). Only 56 districts have jumped two quartiles (30 up, 26 down).
Projecting inter-district inequality in vaccinations, going forward
How will vaccine inequality look like if the current pace of vaccination in districts holds? Exact projections for the first two charts shown above would have been possible if the breakup of first doses by manufacturer was available. This is because the two major vaccines, Covidshield and Covaxin, have different waiting periods between the first and second dose.
However, the number of total doses administered per 100 adults can tell us about the pace of vaccine administration in different districts. Here too the gap is decreasing currently. The bottom quartile has (adjusted for population) administered doses amounting to 40.3% of top quartile. If the pace in all districts remains the same as the pace in past 15 days, this will increase to 42.3% in the next 15 days and to 43.1% in the next 30 days.
This is the concluding part of a two-part data journalism series on district-wise vaccination coverage in India. The first part built district-wise adult population estimates and used them to look at district-wise and rural-urban inequality in vaccinations.