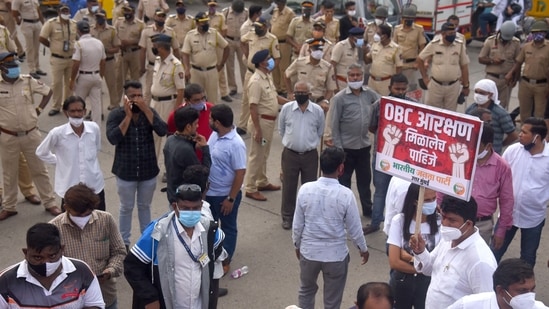
The demand for a caste census is likely to emerge as a major political issue in the run up to the 2024 elections. After the union government filed an affidavit in the Supreme Court saying a caste census cannot be clubbed with the already delayed 2021 decadal census, the Rashtriya Janata Dal (RJD) has written letters to 33 leaders of different political parties demanding support for an immediate caste census.
The demand for a caste census is not without context.
What about average assets by social groups?
AIDIS allows us to separate households into four broad social groups: SC, ST, OBC and others. A look at average asset holdings of each social group underlines the role of caste in economic inequality. Average asset levels of households that do not belong to SC, ST or OBC groups are significantly higher, not just vis-à-vis the SC-ST population but also OBCs.
But all groups display high levels of intra-group inequality in India
While average asset levels do show a relation with social groups, there are large intra-group economic inequalities as well. This is best seen in the fact that the Gini coefficient for asset distribution in each of the social groups is quite high; 0.62 for SCs, 0.64 for OBCs, 0.67 for STs and 0.69 for others. The Gini coefficient can take values between 0 and 1, where 0 denotes perfect equality and 1 perfect inequality.
Another way to describe intra-group inequality within social groups can be to compare the assets owned by the top ten percent compared to bottom 50% within each group. The top 10 percent of OBCs own 5.51 times the total assets owned by the bottom 50% of OBC households. This number is 4.45 for SC households, 5.90 for STs, and 7.97 for those who don’t belong to SC-ST-OBC groups.
This also means the OBCs are not underrepresented within the rich
The most common rhetoric while arguing for doing away with the 50% limit on reservation to accommodate more OBCs is that they are among the poorest in India. An analysis of AIDIS data shows that this is at best a half-truth. Because OBCs are the single largest social group in India, even a low share among the rich is consistent with as many OBCs in these ranks as other social groups, especially those who do not belong to SC-ST-OBC groups. An HT analysis of unit level data from AIDIS shows that OBCs had the largest share among households in each decile class except the top 10%, where households outside the SC-ST-OBC groups account for almost half the total share. The overall share of OBC and non SC-ST-OBC households in AIDIS is 43.5% and 27.2%. Simply speaking, OBCs dominate the ranks of both the rich and poor.
OBCs are the single largest population group but they are far from a homogenous cohort, both socially and economically. The union government recognises 2,479 OBC sub-castes in its list as of 2018, according to the social justice ministry’s website. In 2017 the current government set up the Justice Rohini commission to sub-stratify reservation for OBCs on the grounds that certain sub-castes had gained disproportionately from the policy. Because there is no data on sub-caste population, leave alone socio-economic aspects of OBCs, whether or not the economic inequalities between OBCs are a function of sub-caste is difficult to answer.
AIDIS numbers cited above underline the problems with any argument selling reservation as a silver bullet to the socio-economic deprivation of OBCs in India. Reservations only offer an edge in competing for government jobs, which are on a declining trajectory from an already small base in India.
Given intra-group inequalities within OBCs, the relatively well-off are more likely to gain from such opportunities. Any efforts to tilt the scales in favour of the underprivileged OBCs is likely to run into resistance from the Mandal era parties, where the dominant OBCs are in leadership.