The charts that matter
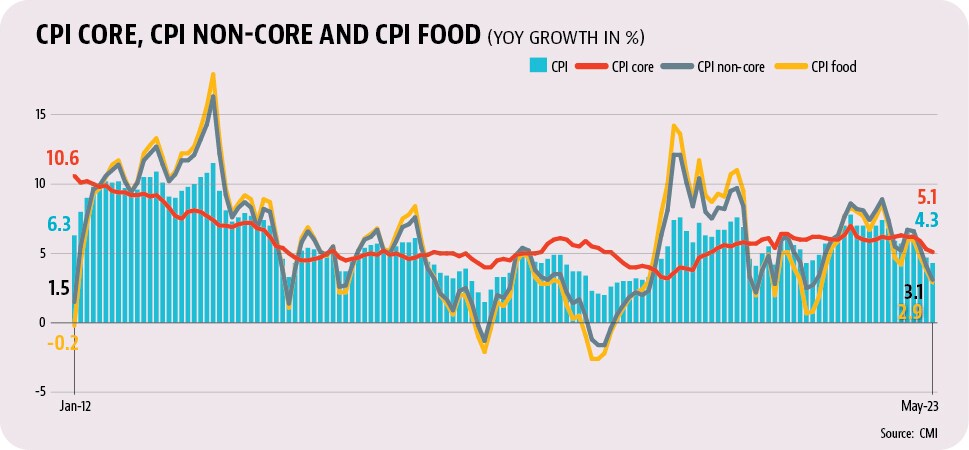 India’s inflation volatility is largely on account of non-core inflationMonthly inflation data under the current Consumer Price Index (CPI) series is available from January 2012. If one leaves out the period before mid-2014, when inflation was extremely high largely on account of the global commodity price cycle, core inflation – this measures non-food non-fuel retail inflation and has a weight of 54% in the overall CPI basket – has largely been in the 4-6% range. This number also does not show any sudden changes. The reason the headline CPI print has shown more volatility (and been above the upper band of RBI’s target range of 2%-6%) is because the non-core component of CPI is far more erratic. This is mostly the result of volatility in food prices, and sometimes sharp changes in global petroleum prices.
- The rich have a disproportionately large share in consumption of non-food itemsIn a textbook world of mainstream economics, inflation is largely seen as a demand-side problem. An inflation-targeting framework is designed to tackle precisely this . Higher interest rates deflate “excess” demand (hence the metaphor of overheating) and control prices. But is this the case in India? Had the government had not junked the findings of the 2017-18 Consumption Expenditure Survey (CES), we would have had a new GDP and CPI series which would have been more representative of the current consumption patterns in the Indian economy. With this caveat in place, the only official source that can tell us about the class-wise importance of different items in consumption is the 2011-12 CES. An HT analysis of decile-wise monthly per capita expenditure (MPCE) shows that non-food consumption is heavily skewed in favour of the rich while the poor have a roughly equal share in the consumption of food, especially cereals and vegetables. This also means that a supply shock for items such as cereals and vegetables is more likely to stoke inflation fires across the board more than a similar supply shock in non-food items which anyway are not consumed much by the non-rich.
- But bulk of the economic growth is driven by the rich in IndiaA simple comparison of Gross Value Added (GVA) and employment shares is enough to drive home this point. Agriculture and allied activities have an employment share of more than 45% but their share in GVA is less than 15%. Construction accounts for another 12.4% of employment share with a GVA share of 8.2%. Financial services, real-estate and professional services, which have an employment share of just 2.9%, have a GVA share almost at par with the two employment intensive sectors mentioned above. This asymmetry in income and employment shares – a comparison of MPCE decile-wise consumption shares given above shows the same thing – captures how India’s GDP growth can increase or decrease even if fortunes of a small share of the population change.
- What does this mean for the economy?Most importantly, this requires that supply-side management be a large part of our inflation management strategy. Repeated tweaks in domestic and international trade and pricing policy of food items are precisely that. The only catch is that most policy interventions to control inflation worsen the terms of trade against agricultural producers, thereby exacerbating the inflation-by-poor-and-growth-by-rich asymmetry.
All Access.
One Subscription.Subscribe NowAlready subscribed? Login
One Subscription.
Get 360° coverage—from daily headlines
to 100 year archives.
E-Paper
Full
Archives
Archives
Full Access to
HT App & Website
HT App & Website
Games
Track live Stock Market Today updates and check your NSE IPO Allotment Status Today. Stay informed with the latest business news like N Chandrasekaran, petrol and diesel prices, gold and silver rates, income tax updates, and major economic developments across India and globally.
Track live Stock Market Today updates and check your NSE IPO Allotment Status Today. Stay informed with the latest business news like N Chandrasekaran, petrol and diesel prices, gold and silver rates, income tax updates, and major economic developments across India and globally.
Advertisement
{{/htLoading}}{{#usCountry}}