Between 4 pm on October 29 and 4 pm on October 30, Delhi’s air quality index or AQI spiked by almost 100 points, from 279 to 373, pointing to either a sharp increase in pollution or an underreporting of the index on October 29. With the index, which is a rolling 24-hour average crossing 370 early in the morning of October 30, the air pollution between 4 pm on Wednesday and 10 am on Thursday would have had to be deep in the red -- the kind of spike that is physically not probable.
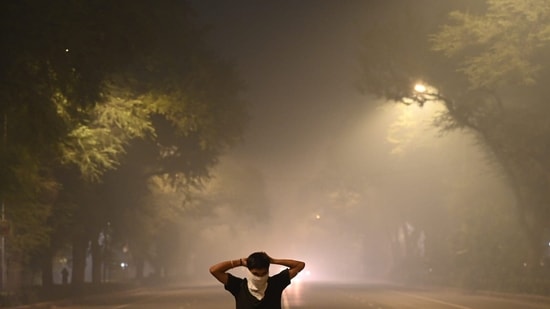
A Hindustan Times analysis of AQI readings over the past three days, and satellite imagery modelled estimates of pollution suggest that Thursday’s reading could be a result of both -- a spike over the past 24 hours, and previous underreporting. After all, Wednesday (October 29), looked visibly like a 350-plus day, as long-time sufferers in the Capital can vouch.
AQI readings on October 28, 29 and 30 point to this
{{/usCountry}}AQI readings on October 28, 29 and 30 point to this
{{/usCountry}}There has been a visibly dense haze in Delhi for the past three-four days. Anecdotally speaking, the official AQI numbers for October 28 and 29 – the 24-hour averages at 4pm were 294 and 279 – seemed to underestimate the ambient pollution. On October 30, the haze was largely similar to the previous two days, but the AQI reading increased to 373 in the Central Pollution Control Board bulletin, a jump of almost hundred points. What really led to this?
Not a calculation error
HT independently calculated the 24-hour average of AQI from sub-indices of individual pollutants at each station to check if there was a calculation error that had kept the AQI low in the past two days. No such error was found. The 24-hour average AQI at 4 PM on October 28 and 29 as calculated by HT was 294.9 and 278.8. Both numbers are within a point of the bulletin readings. At noon on October 30, HT’s calculation showed an AQI of 375.7, also similar to the then reading on the Sameer App, and close to the 373 reading in the bulletin published including the next four hours.
And PM2.5 concentrations also show a big spike in the October 29-30 period compared to the previous two days
In addition, HT also compared hourly AQI trends (calculated from the National Air Quality Index website) with the trends in PM2.5 concentrations (taken from the Central Control Room for Air Quality Management). Both AQI and PM2.5 concentrations show that the October 27-28 air quality was similar to October 28-29 air quality; and that there was a big spike from both these days on October 29-30. Given that there was no significant change in meteorological conditions, and no adverse event (such as excessive bursting of fireworks or a large farm fire) the only logical explanation is that there is something wrong with the October 28-29 pollution readings.
See Charts 1A, 1B
Cross checking with satellite data supports this theory
Since the big spike in air pollution in October 29-30 hourly data did not appear to match change in perceived air pollution levels, HT checked satellite derived forecasts of PM2.5 concentrations from Copernicus Atmosphere Monitoring Service (CAMS). While these are forecasts, they start off each run by combining a previous forecast with other satellite derived data, which happens at 05:30 AM; and can be taken to give an indication of trends. Simply speaking, this is scientific modelling based on satellite imagery with little scope for human intervention.
CAMS data shows that the spike recorded in official air quality data is much bigger than in the forecast, particularly in the period after midnight on October 30. For example, the hourly PM2.5 concentration at 5 AM on October 30 in official data was 127% more than the average of the hour on the past two days. In the CAMS forecast for 05:30 AM, which would have assimilated satellite-derived data while initiating forecast for the next five days, the change from the past two days was of only 30%. Such a difference can be seen through most of the early hours of October 30. This somewhat makes sense because temperatures were not much cooler on October 30. The minimum temperature recorded on October 30 was 20.1°C compared to 18.2°C on October 29 and 20°C on October 28. Similarly, the maximum temperature on October 30 was 27°C, lower compared to 29°C on October 29, but higher than 26.4°C on October 28.
This difference between the AQI data and the CAMS forecast does not conclusively prove that there are measurement issues with India’s AQI data. However, it does lend some credence to what every Delhi resident’s lungs were telling them on Tuesday and Wednesday -- the air seemed worse than the AQI suggested.
But like every cloud, this one (of bad air) too has a silver lining: Thursday’s reading suggests we can take the AQI index released by the government at face value again.