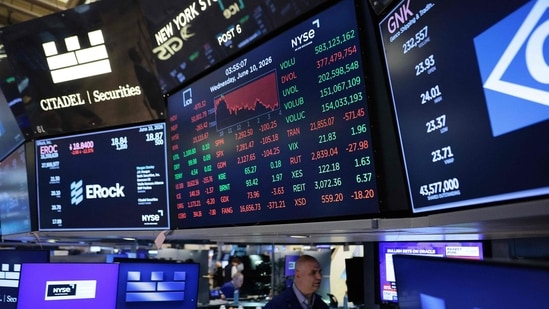
US stocks have had a strong run in 2026, but a correction risk is now growing. The S&P 500 has gained about 13%, while the Nasdaq Composite has risen around 14% through the first eight months of 2026. Both major indexes are on track for another year of double-digit gains.
If the gains continue, the S&P 500 and Nasdaq would record their fourth straight year of double-digit growth. But the stock market rally could now face a major test. Inflation is staying high, and this could push the Federal Reserve to raise interest rates again.
Higher interest rates are a problem for stocks. Rate hikes can make borrowing more expensive for companies and consumers. They can also make bonds and other safer investments more attractive compared with stocks. The latest inflation numbers have increased concerns about the US economy. Inflation is not falling as quickly as experts had expected, raising the chances of more Federal Reserve rate hikes.
Inflation remains above the Fed's target
The Federal Reserve's preferred inflation measure is the Personal Consumption Expenditures (PCE) price index. The PCE index tracks spending on goods and services and includes both money consumers spend on themselves and spending made on their behalf, according to The Motley Fool.
The Consumer Price Index (CPI) works differently. CPI mainly looks at consumer out-of-pocket spending, while PCE also includes spending made by third parties on behalf of consumers. PCE inflation was 2.9% in January 2026. But inflation has increased since then, showing that price pressures have not gone away.
{{/usCountry}}The Consumer Price Index (CPI) works differently. CPI mainly looks at consumer out-of-pocket spending, while PCE also includes spending made by third parties on behalf of consumers. PCE inflation was 2.9% in January 2026. But inflation has increased since then, showing that price pressures have not gone away.
{{/usCountry}}Also read: Stock market outlook: S&P 500, Fed rate hike odds and jobs report to watch next week
One major reason behind the rise in inflation is the Iran war. The conflict has disrupted an important shipping route for global oil supplies, pushing energy prices higher. Higher energy prices can affect much more than gasoline. Expensive energy can increase costs for transportation, manufacturing and other parts of the economy.
Trump's tariffs have also added to inflation. Research from several Federal Reserve banks has found that the president's tariffs have made a meaningful contribution to higher prices. The latest PCE number was particularly worrying. PCE inflation reached 3.7% in July. July's inflation number was higher than economists expected. The consensus estimate was 3.6%, meaning the actual number came in slightly above expectations.
Inflation also did not improve from the previous month. The July PCE reading stayed at the same 3.7% level recorded in June, a sign that inflation may be becoming "sticky". PCE inflation has now stayed above the Fed's 2% target for 65 straight months. This means inflation has remained above the central bank's goal for more than five years, The Motley Fool reported.
The problem could continue if energy prices remain high. The Iran war and Trump's tariffs could keep inflation elevated for longer. There is also a risk that higher energy costs spread across the economy. If energy stays expensive for a long time, transportation and manufacturing costs could also rise.
Two Fed rate hikes are now possible
The July inflation report has increased expectations for more interest rate hikes. The CME Group's FedWatch tool showed that traders are now pricing in a higher chance of rate increases this year. Futures traders are now betting on two quarter-point rate hikes before the end of 2026. One hike is expected in September, while another could come in December, The Motley Fool reported.
That could become a major problem for the stock market. Historically, new Federal Reserve rate-hike cycles have often been followed by stock market corrections. Historical data shows how stocks have performed after the first rate hike of a cycle. Since 1987, the S&P 500 has fallen as much as 10%, while the Nasdaq Composite has fallen as much as 14% at some point during the following year. That means both indexes have historically entered correction territory after the start of a new rate-hike cycle. A correction generally means a decline of at least 10% from a recent peak.
Also read: Is Wall Street’s calm about to end? What rising VIX means for S&P 500 stocks
S&P 500 valuation is raising another warning
High interest rates are not the only concern. The stock market is already looking expensive compared with historical levels. The S&P 500's valuation has reached a level last seen around the dot-com crash. Its cyclically adjusted price-to-earnings ratio, known as the CAPE ratio, reached 40.6 in July.
A CAPE ratio of 40.6 is a major warning sign because it has happened very rarely. The level was the highest since September 2000, when the dot-com bubble was beginning to collapse. The dot-com crash was extremely painful for investors. During that crash, the S&P 500 eventually lost about 49%, while the Nasdaq Composite plunged around 78%.
Historical data shows that very high CAPE levels have often been followed by weak stock returns. Data from Robert Shiller and YCharts looked at periods when the S&P 500's monthly CAPE ratio moved above 40. The average S&P 500 return after a CAPE reading above 40 was negative over longer periods. The average return was around -3% after one year, -19% after two years and -30% after three years, according to the historical data cited by The Motley Fool.
The Nasdaq showed an even bigger decline over longer periods. Its average return was about 1% after one year, -41% after two years and -51% after three years following periods when the S&P 500's CAPE ratio topped 40. If history were to repeat itself, the losses could be significant.
Based on those historical averages, the S&P 500 could fall about 30% and the Nasdaq could drop about 51% by August 2029. However, this does not mean those declines are guaranteed. Historical stock market performance cannot predict exactly what will happen in the future, The Motley Fool cautioned.
There is also a limitation in the historical data. The S&P 500 has had a CAPE ratio above 40 in only 25 months since the index was created in 1957, meaning the sample size is relatively small. The S&P 500 has been this expensive only about 3% of the time in its history. That makes the current valuation unusual.
What investors should watch now
The combination of high inflation, possible rate hikes and expensive stock valuations is creating a bigger risk for investors. These three factors could make it harder for the current bull market to continue at the same pace. Investors should therefore not ignore the warning signs. The historical data does not guarantee a crash, but it shows that very high valuations have previously been followed by weaker stock market returns.
The biggest concern is that the Fed may have to keep rates higher for longer. If inflation remains above the 2% target, the central bank could have less room to cut rates and may instead consider further hikes. For investors, stock selection could become more important. The Motley Fool recommends focusing on companies with strong and lasting competitive advantages, often called competitive moats, rather than buying stocks simply because the broader market is rising.
Price also matters. Investors should look for companies with strong businesses that are still trading at reasonable valuations. The key warning for the market is simple: the S&P 500 and Nasdaq have enjoyed strong gains, but sticky inflation and possible Fed rate hikes could put the rally under pressure, while historically high valuations could increase the size of any correction.