The World Health Organization’s (WHO) new standards for acceptable pollution levels announced on Wednesday mean that Delhi’s prolonged battle for clean air is going much worse than previously thought. Even the handful of good air quality days that Delhi was getting each year were not really so as per the new “safe” norms, shows an analysis of recent years’ data by HT.
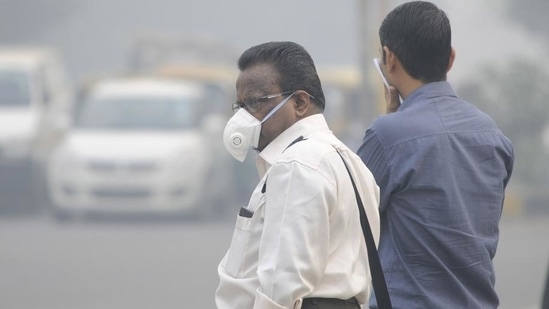
The rare days that Delhi met the 24-hour targets of air pollution in 2019 and 2020 go down drastically if seen against the revised standards, while in 2021, not a single day has passed where the Capital’s air has been acceptable by the new threshold, according to the analysis.
The revised standards were issued by WHO on Wednesday for six air pollutants which include PM2.5 and PM10. For daily PM2.5 levels, the safe zone was brought down from 25µg/m³ in 2005 to 15µg/m³, while it was reduced from 50µg/m³ to 45µg/m³ for PM10.
By the old PM2.5 standards, Delhi had 16 good air days in 2019, while the city got 36 such days in 2020 (helped by Covid lockdowns), and has had 13 such days so far in 2021. While these are very few in themselves, the corresponding figures for the new target are only two and three good air days in 2019 and 2020 respectively, and not even a single day below the new threshold in 2021.
The Capital fared poorly on PM10 concentrations levels too. The old daily PM10 targets were achieved in Delhi on six days in 2019, 23 days in 2020, and seven days so far in 2021. But when the new standards are applied, Delhi’s days of breathable air go down to just four in 2019, 16 in 2020, and six in 2021.
Air quality stations in Delhi provide data on two types of pollutants consistently: PM2.5 and PM10. The concentrations from these stations were averaged to arrive at average concentration for the city. Most of the 40 stations in Delhi have nearly complete data for all days since 2019. Six stations have either no PM2.5 data for a particular year since 2019 or data for only a few days. The number of such stations for PM10 data is 11. These stations were excluded from the analysis of the respective pollutants.
{{/usCountry}}Air quality stations in Delhi provide data on two types of pollutants consistently: PM2.5 and PM10. The concentrations from these stations were averaged to arrive at average concentration for the city. Most of the 40 stations in Delhi have nearly complete data for all days since 2019. Six stations have either no PM2.5 data for a particular year since 2019 or data for only a few days. The number of such stations for PM10 data is 11. These stations were excluded from the analysis of the respective pollutants.
{{/usCountry}}If we look at annual averages, however, Delhi’s air has never been at acceptable levels under the old standards, leave alone the stricter ones introduced on Wednesday. In fact, even by the 2005 yardstick, Delhi’s air was several times worse than what was considered safe.
The annual average of PM2.5 levels in Delhi was 109.7µg/m³ in 2019, 95.3µg/m³ in 2020, and is 85.1µg/m³ till September 21 this year. These are all above the new target (5µg/m³) for average annual concentration, the 2005 target (10µg/m³), as well as India’s (more lenient) National Ambient Air Quality Standards of 2009 that sets the standard at 40µg/m³.
Similarly, PM10 concentrations have failed to meet any annual target since 2019, the earliest year for which data was analysed by HT. The annual average in Delhi was 220.3µg/m³ in 2019, 180.8µg/m³ in 2020, and is 185.3µg/m³ so far in 2021. These figures are 15, 12, and 12 times the new annual target of 15µg/m³ and 11, nine, and nine times the old annual WHO target of 20µg/m³.
Stay updated with all top Cities including, Bengaluru, Delhi, Mumbai and more across India. Stay informed on the latest happenings in World News along with Delhi Election 2025 and Delhi Election Result 2025 Live, New Delhi Election Result Live, Kalkaji Election Result Live at Hindustan Times.
Stay updated with all top Cities including, Bengaluru, Delhi, Mumbai and more across India. Stay informed on the latest happenings in World News along with Delhi Election 2025 and Delhi Election Result 2025 Live, New Delhi Election Result Live, Kalkaji Election Result Live at Hindustan Times.