E-Paper



How is Nitish Kumar’s current govt different from his other ones | Number Theory
HT has created a database of Bihar’s CoMs between 1952-77 and all CoMs post 2005

 Prefer HTon Google


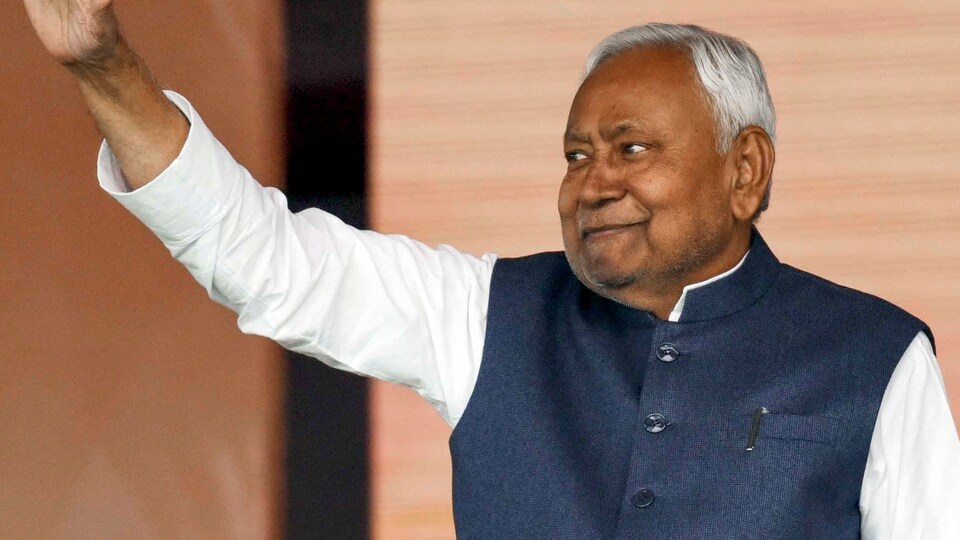
On November 20, Nitish Kumar took the oath as the chief minister of Bihar for the record tenth time, the highest for any chief minister in India. Along with Kumar, 26 other ministers were also administered the oath of office on Thursday. To be sure, the current strength of the Council of Ministers (CoM) is lower than what it has been in the past and we will likely see more ministers being sworn in later.
This, however, should not stop us from analysing the latest CoM on various aspects. How is Nitish Kumar’s current Council of Ministers (CoM) different from his previous ones? Ideally, one should have asked this question vis-à-vis all CoMs Bihar has had, but a gap in data availability – there is no official list of Bihar’s CoMs between 1977 and 2005 – prevents us from doing this exercise. HT has created a database of Bihar’s CoMs between 1952-77 and all CoMs post 2005. While a larger historical comparison of Bihar’s CoMs will wait for this data gap to be fulfilled – which HT will eventually do by consulting other sources – it is useful to compare the profile of Nitish’s cabinets themselves. Here is what the data shows.
 JD(U)’s share in the current CoM is the lowest since 2005This is another statistic which captures the irony facing the Janata Dal (United) or JD(U) in the state. While its leader has proved himself to be indispensable for winning Bihar, the party has had to cede space to not just the Bharatiya Janata Party (BJP) but also smaller allies this time. What we have as a result of this is the JD(U) accounting for just one-third of the CoM, the lowest this number has ever been. To be sure, even the BJP has seen a marginal decline in its share on the CoM between the new and the previous government but that is because of the accommodation of smaller allies in the government. The BJP had a more than 50% share in CoM in both the outgoing and the new CoM. It is worth underlining here that 2025 was also the first election for the JD(U) where it contested a similar number of ACs as the BJP in the NDA coalition ; previously the JD(U) was always the senior partner.
- The new CoM’s social profile is almost the same as NDA’s MLAs this timeOf the total 27 people, including Nitish Kumar, who took oath on Thursday, 8 are from Hindu upper castes, 5 each belong to Scheduled Caste (SC) and Extremely Backward Classes (EBCs), 6 belong to Backward Classes: Non-Yadav (BC: Non-Yadav), 2 from Yadav caste and one is Muslim. This is almost the same as the social profile of NDA MLAs elected this time, which was analysed in these pages after the results: Hindu upper castes, or those who are not Scheduled Caste (SC), Scheduled Tribe (ST), Backward Classes (BC) or Extremely Backward Classes (EBC), have the highest share in the CoM.
- How does the current CoM differ from previous ones?In the CoM between January 2024 and November 2025, EBCs had a share of 25% which is currently 18.6%. Hindu upper castes have a similar share of around 30%, while the share of Yadavs increased from 2.8% to 7.4%. Hindu upper castes had the highest share in the CoM between November 2010 and May 2014 at 36.7%. EBCs had the highest share in the recently dissolved cabinet at 25%. Yadavs had the highest share of 24.1% between 2015 and 2017 when there was an alliance in the state between Nitish Kumar, JD (U) and the Rashtriya Janata Dal (RJD).
- CoM continues to be highly gender skewedOnly 3 out of 27 members in the CoM are women in 2025. The number of women who made it to the legislative assembly in 2025 is 29, the second highest since 1962. The maximum number of women who won the assembly elections was in 2010, at 34. To be sure, the number of women in the Bihar CoM always remained just 2-3 between 2005 and 2025.