
 E-Paper



Number Theory: Delhi's legislature, executive profiled — 2
.
Updated on: Mar 20, 2025, 08:53:36 IST

 Prefer HTon Google
Share via


Copy link

The first part of this series examined the details of Delhi’s MLAs and ministers by party and region. The concluding part looks at their caste and religion to examine how the executive and legislative branches in the Capital have evolved over the decades. As caste identities are often not part of official records and their broad classification into other backward classes (OBCs), Scheduled Castes (SCs) and Scheduled Tribes (STs) and others vary across states, multiple rounds of cross-checks have been made with various official and unofficial sources.
Delhi's legislature, executive profiled — 2
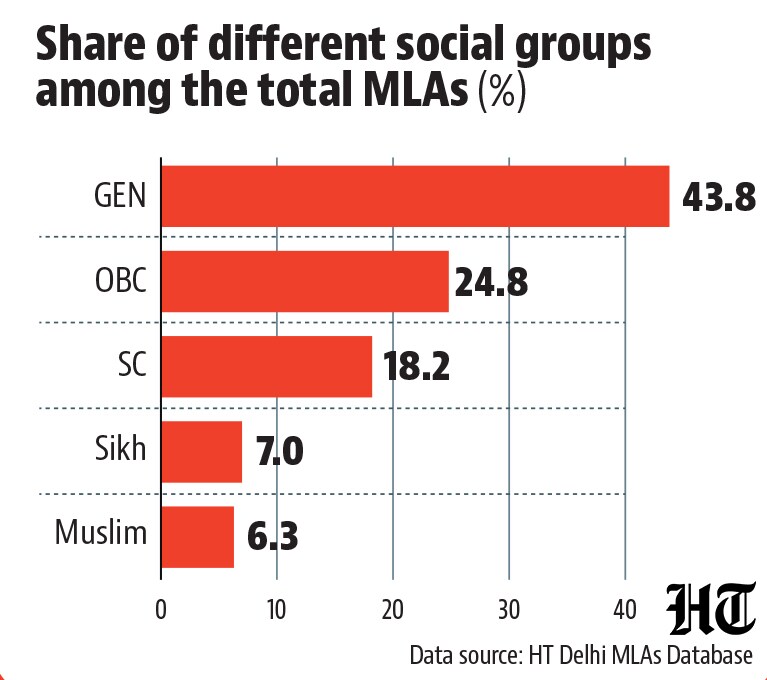
 Non-SC/ST/OBC Hindu MLAs have the highest share in the database at 43.8%According to the latest National Family Health Survey Data, 2019-21, “upper caste” Hindus – those who do not belong to OBCs, SCs or STs -- have a 43.9% share in Delhi’s population. This is the third highest share in the country after Himachal Pradesh (51%) and Uttarakhand (44%). The share of SCs and Hindu OBCs in the Delhi population is 23.5% and 14.9%. Muslims and Sikhs constitute 12.9% and 3% of the total population share. The so-called Hindu upper castes have a share of 43.8% in Delhi’s total MLAs, which is followed by OBCs (24.8%) and SCs (18.2%), followed by Sikhs and Muslims at 7.5% and 6.3% respectively.
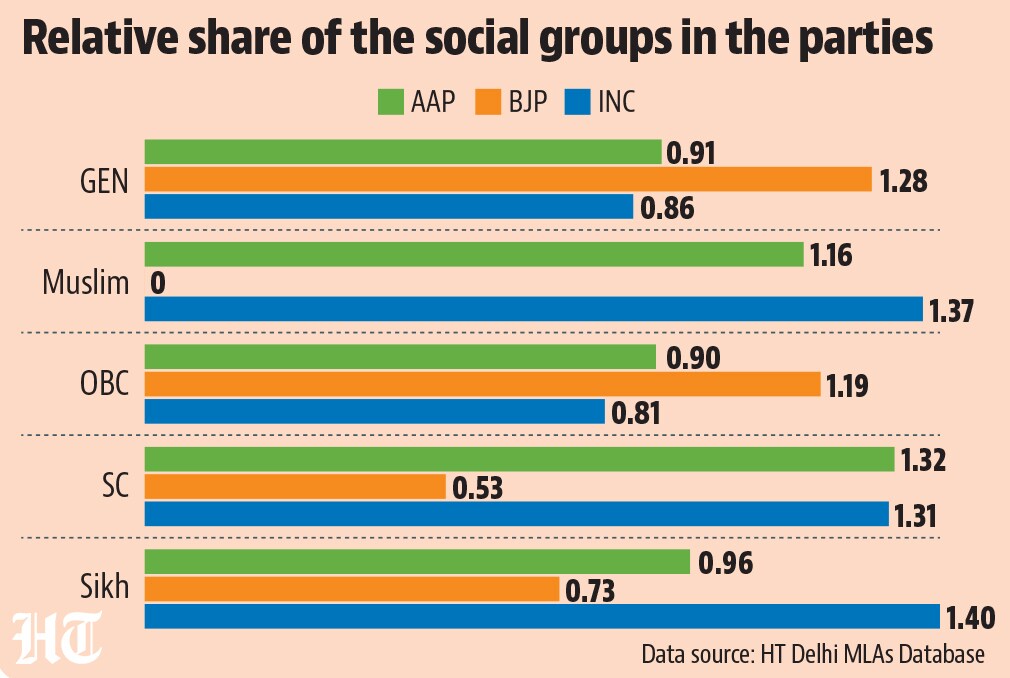
- BJP has the highest relative share for 'upper caste' and OBC Hindu MLAs, while Congress and AAP are ahead in Muslims, Sikhs, and SCsAn analysis of MLAs by caste and religion for different parties shows that upper castes (56%) and OBCs (29.4%) have the highest share among BJP MLAs followed by SCs and Sikhs. The largest chunk of SC MLAs come from the AAP (24.02%) followed by the Congress (23.78%) and the BJP (9.64%). For Muslims and Sikhs, the party-wise share is highest for the Congress at 8.54% and 9.76% respectively. To be sure, looking at the relative share of various social groups among BJP, AAP and Congress MLAs is a better way to measure their social composition. This has been calculated by dividing the share of a particular social group among a party’s MLAs divided by its overall MLAs. A relative share greater or smaller than 1 would signify an over-representation or underrepresentation of a particular group within a party. The relative share trend is not very different from the absolute shares of various social groups among each party’s MLAs.
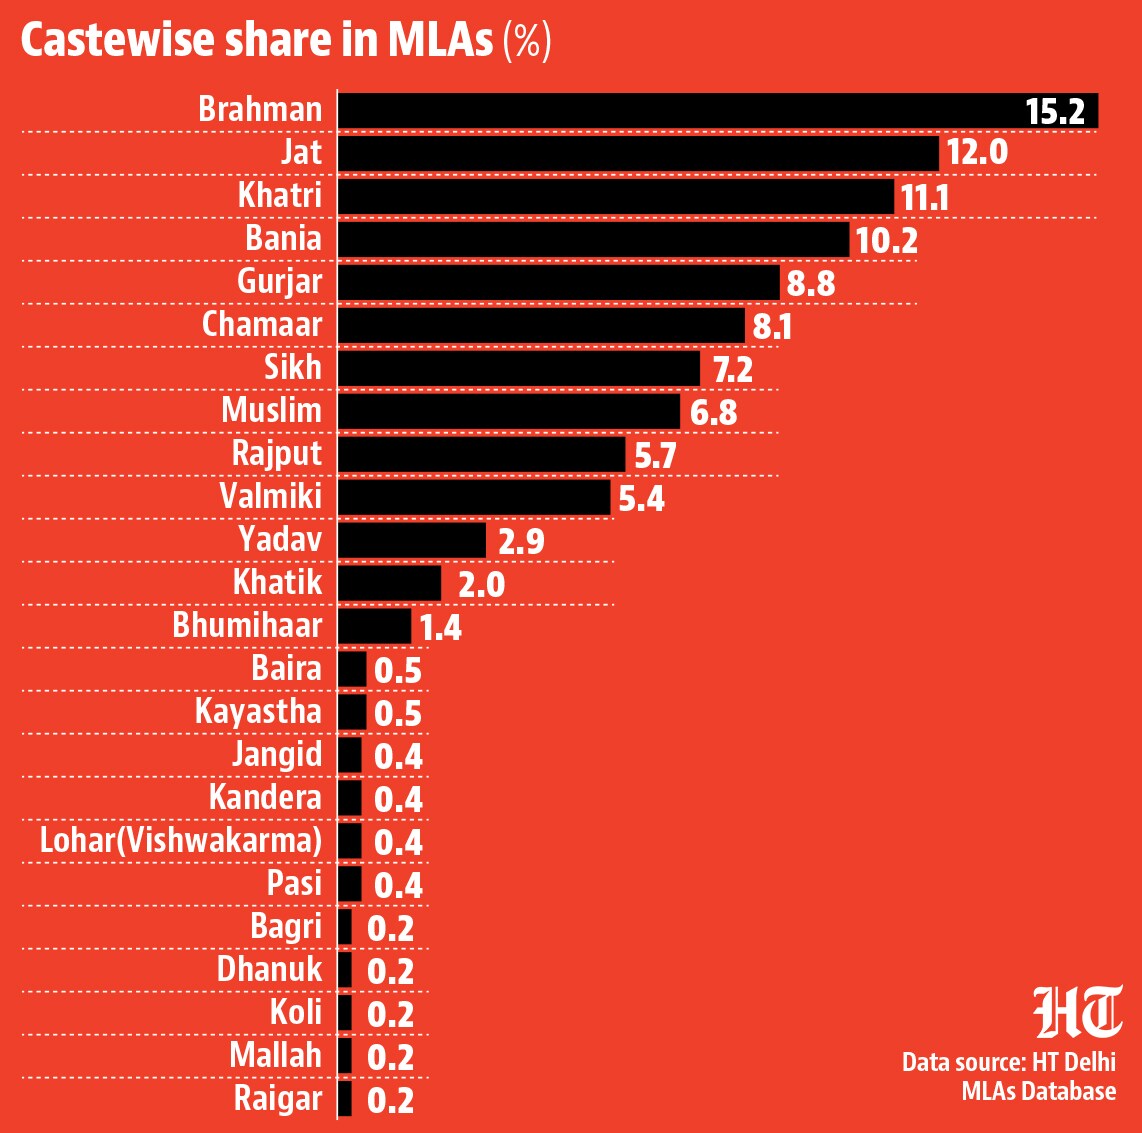
- Eight caste groups constitute 80% share in the databaseA caste-wise analysis of the members in the database shows that Brahmins have the highest share in the database at 15.2%, followed by Jats, Khatris (Hindu Panjabis), Banias, and Gurjars at 12%, 11.1%, 10.25% and 8.8% respectively. Eight caste groups alone have a share of 80% in the database. A total of 24 castes have been represented in the database from 1993 to 2025. The share of different caste groups shows significant variation between 1993 and 2025. For instance, the number of Khatri MLAs came down from 16 in 1993 to four in 2025. The number of Brahmin MLAs has remained between eight and 12, except in 2015 when it was 14 — the highest ever. The combined number of Jat and Gurjar MLAs — the two most dominant OBC groups in Delhi — was highest at 21 in 2008, came down to 15 in 2013, then to 11 in 2015, before increasing to 12 in 2020 and 14 in the current assembly. Eleven caste groups have a share of less than 1% in the database, and they constitute an overall share of 3.4% in the database.
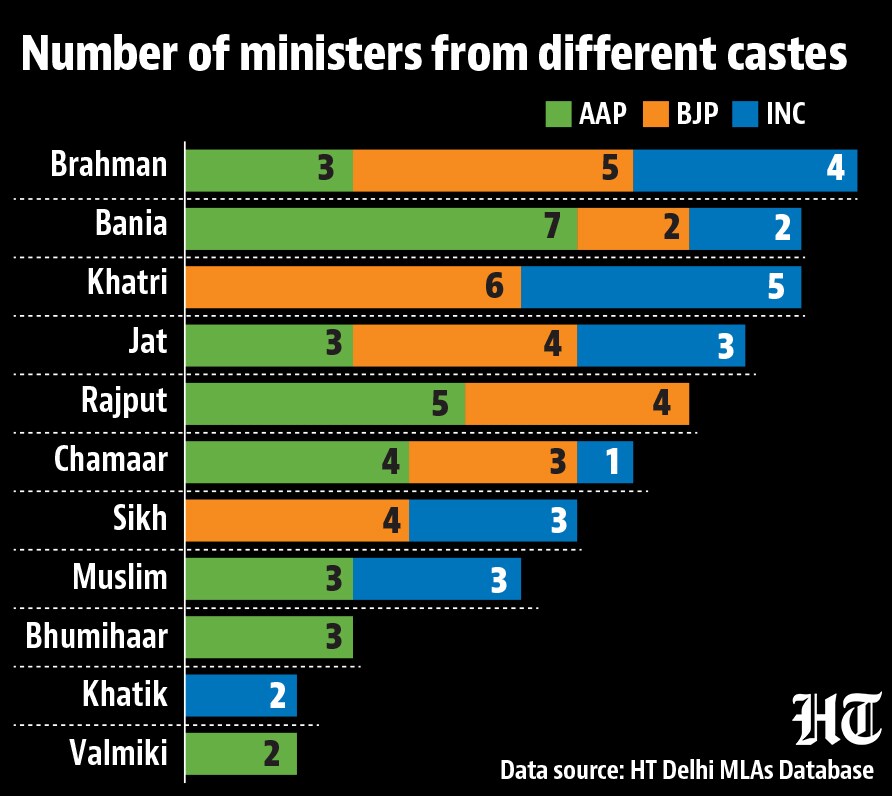
- 'Upper castes' have the highest share in the council of ministers, followed by SCsHT has also compiled a list of everyone who has been a part of the council of ministers in Delhi since 1993. So far, 81 people have become ministers in the Delhi assembly. Of these, 56.8% come from upper castes. The share of OBCs (12.3%) in the council of ministers is lower than that of SCs (14.8%). The share of Sikhs and Muslims stand at 8.6% and 7.4% respectively. In the caste matrix, Brahmins constitute 14.8% of the 81 members followed by Banias (13.6%), Khatris (13.6%), Jats (12.3%), Rajputs (11.1%), and Chamaars (9.9%). No Gurjar MLA so far has been able to get a berth in the council of ministers. Among the 12 SC ministers, eight belong to the Chamaar caste and two each to Khatik and Valmiki castes. Of the 11 ministries in Delhi since 1993, Brahmins have been represented in 10 of them; the same as Jats. Rajputs have been represented eight times (each time, except in three councils headed by Sheila Dikshit). Banias, Khatris, Sikhs and Chamaars have been represented in seven out of the 11 councils.

Unlock a world of Benefits with HT! From insightful newsletters to real-time news alerts and a personalized news feed – it's all here, just a click away! -Login Now!


