E-Paper



Number Theory: How December cooled down in the second week
.
Published on: Dec 16, 2024, 08:18:36 IST

 Prefer HTon Google
Share via


Copy link

December is the first month of India’s official winter season, which runs from December to February. How has the winter season started? The short answer is that the December so far is like November, which started warm and then cooled down. The long answer is as follows.
How December cooled down in the second week
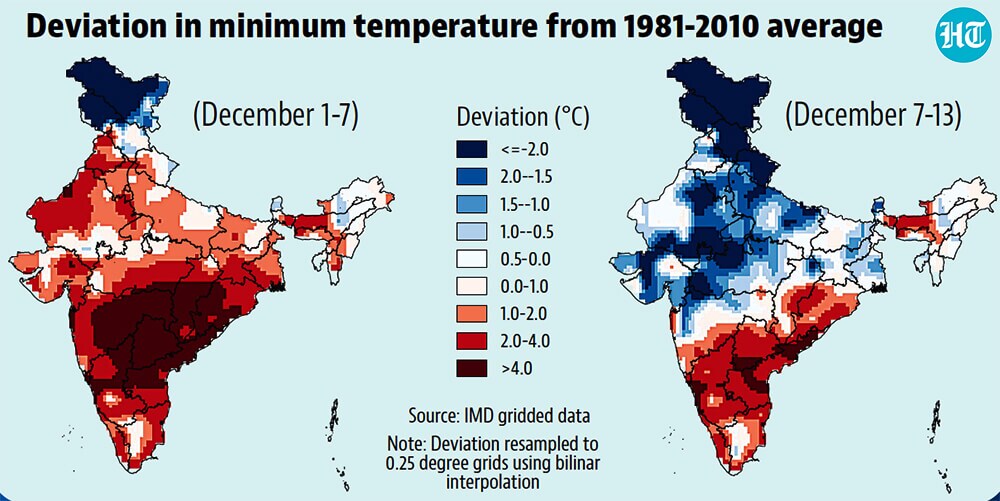
- Maximum temperatures are lower than normal and minimum temperatures warmerThe average maximum temperature for India for the December so far is 25.72°C, according to the gridded data of the India Meteorological Department (IMD). This is the 16th coolest maximum for this part of the month since 1951, the first year for which IMD has published this data; and 0.77°C cooler than the 1981-2010 average, considered the normal for temperature by the IMD. The average minimum, on the other hand, is 13.16°C, 21st warmest since 1951 and 0.73°C warmer than normal. This is somewhat like November, when the average maximum was close to normal and the average minimum warmer than normal.
 However, both maximum and minimum temperatures got lower than normal in the second weekIndia’s average maximum was cooler than normal on some days even in the first week of the month. However, this downward deviation became more acute and consistent only in the second week. This is why the month so far looks one of the coolest historically on average by this metric. On the other hand, minimum temperatures were more than 1°C warmer than normal on all days of the first week of December. They cooled down below normal only from December 10. This is why minimum temperatures look warmer than normal on average. To be sure, the daily trajectory of the deviation in minimum temperature is similar to that of the maximum temperature: going upwards up to December 5 and then climbing down. Clearly, trends seem shifted between the first and second week of December. This happened for minimum temperatures in both the northern and southern half of the country, but by different degrees. The southern half came closer to normal in the second week, but still remained largely warmer than normal. The northern half, on the other hand, was warmer than normal in the first week and turned cooler than normal in the second. For example, the minimum temperature at the Safdarjung observatory in Delhi dropped from 8°C on December 10 to under 5°C on the next two days. While Delhi warmed up on December 13, the trend continued in rest of north-western India.
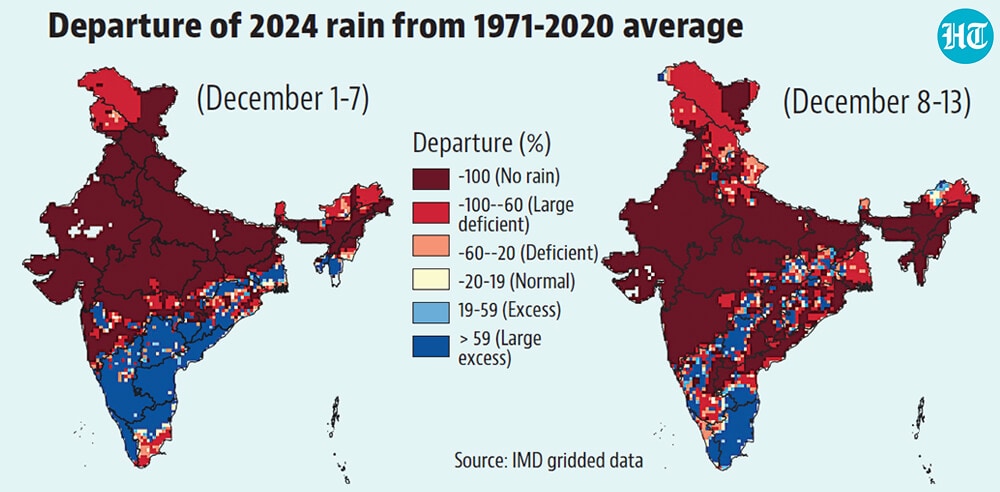
- Rains explain the trends in the southern half of the country…Clouds trap the heat received during the day. Therefore, minimum temperatures are usually warmer than normal when it rains. This explains the minimum temperature trends in peninsular India, which received a huge surplus of rain in the first week due to Cyclone Fengal. Such surplus became geographically limited in the second half, allowing minimum temperatures to drop closer to the normal in the second week.
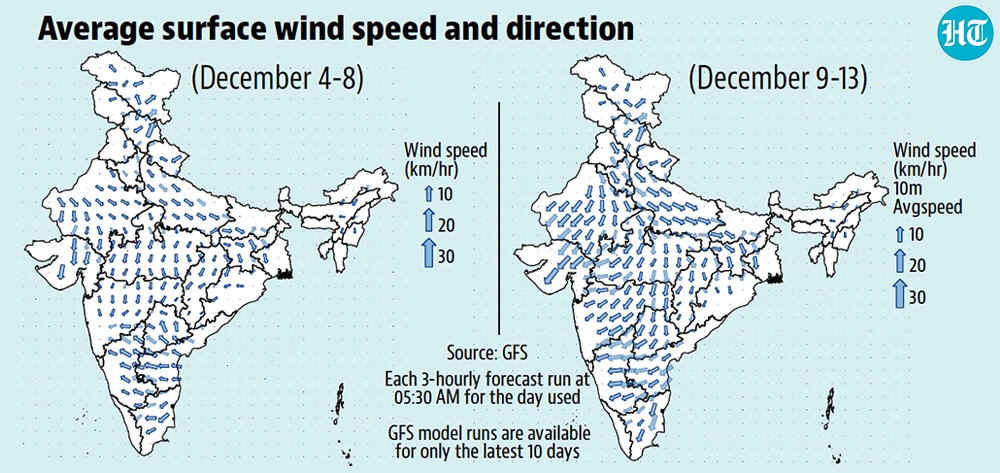
- …and winds explain the trends in the northern half of the countryThe rainfall maps above do not explain the trends in minimum temperatures in the northern half of India. This is because while a western disturbance (storms originating west of India, usually in the Mediterranean region) caused some rain here, it mostly resulted in clouds and slower winds. This change after the western disturbance passed. The change in wind speed can be seen in the accompanying maps constructed using daily forecasts from the Global Forecast System (GFS) model run by the National Centers for Environmental Prediction (NCEP) in the USA.