E-Paper



Number Theory: How Jharkhand's fortunes evolved since formation
.
Published on: Nov 13, 2024, 08:51:12 IST

 Prefer HTon Google
Share via


Copy link

Forty-three out of the 81 assembly constituencies (ACs) in Jharkhand have gone to polls today, November 13. On November 15, it will be 24 years since Jharkhand was carved out as a separate state from Bihar after decades of protests. Jharkhand came into being as a separate state along with two more states, Uttarakhand and Chhattisgarh, which were carved out of Uttar Pradesh and Madhya Pradesh. How have the three states fared economically over the last two and a half decades? This is an important question to ask because the future of a better and just economic promise was an important motivation in the movement for creation of each of these three states. Here is what the data shows.
How Jharkhand's fortunes evolved since formation
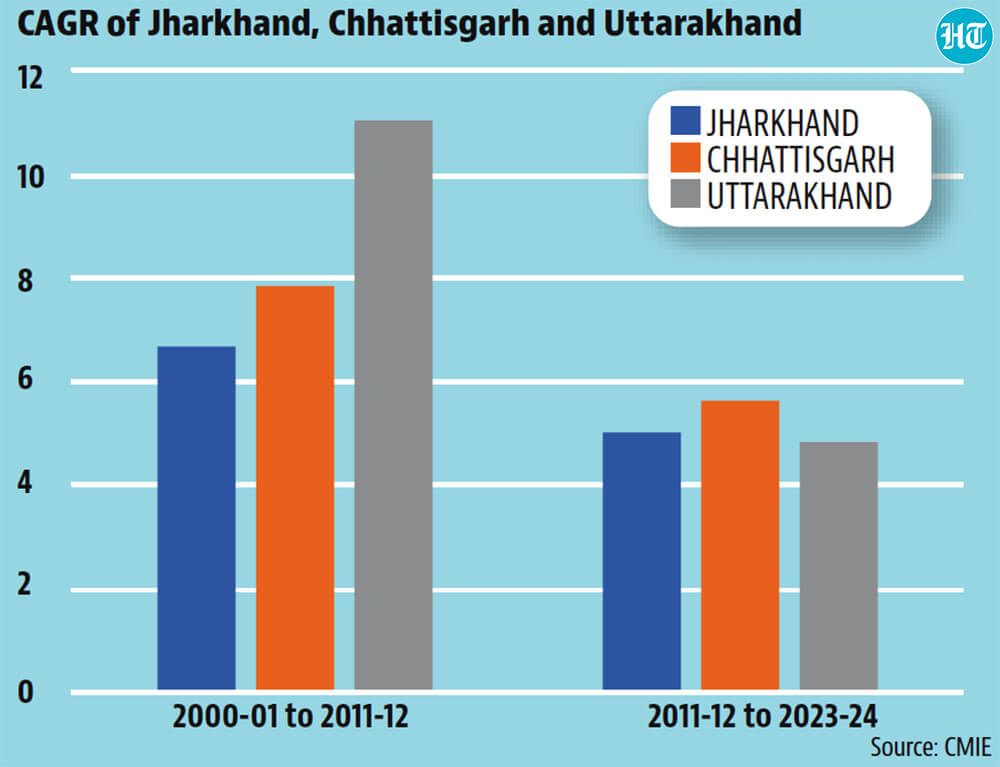
 Jharkhand lost its relative advantage in GSDP vis-a-vis Uttarakhand and ChhattisgarhA simple comparison of gross state domestic product (GSDP) data shows this clearly. In 2000-01, Jharkhand’s GSDP (2004-05 series in constant prices) was 2.5 times that of Uttarakhand and 1.3 times that of Chhattisgarh. By 2023-24, these numbers had become 1.3 and 0.9 respectively. What explains the loss of Jharkhand’s economic standing vis-a-vis the other two states which were created along with it? Because we do not have continuous GSDP data for the last two decades – 2004-05 series data is available from 1993-94 to 2014-15 and 2011-12 series data is available from 2011-12 onwards – HT has compared the compound annual growth rate (CAGR) of GSDP of the three states for these two periods separately, taking data from 2000-01 to 2010-11 from the 2004-05 series data and 2011-12 and onwards from the following series. The data shows that Jharkhand’s loss of economic advantage is primarily a result of its lower growth in the first decade after its creation. In fact, all three states being compared here show a worse growth rate in the post-2011 period compared to the previous decade.
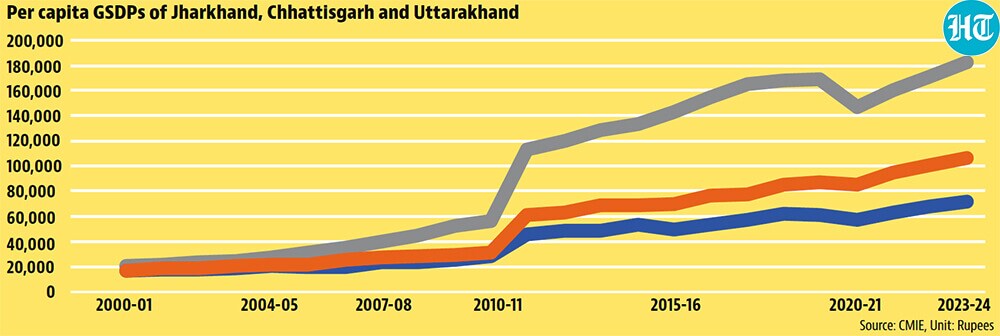
- A growth disadvantage has led to a wider divergence in per capita income levelsLooking at just the GSDPs of the three states may not be enough, since this metric does not take into account the population (which also means workers) difference between the two states. Comparing the per capita GSDPs provides a better idea and the data shows that there has been increasing divergence between the per capita GSDPs of the three states. While Jharkhand had the lowest per capita GSDP in 2000-01, the difference from Chhattisgarh and Uttarakhand was narrow (the two other states had per capita GSDP 1 and 1.3 times that of Jharkhand, respectively). In 2023-24, Jharkhand continued to have the lowest per capita GSDP of the three, but additionally the numbers for Chhattisgarh and Uttarakhand had increased to 1.5 and 2.5 times that of Jharkhand.
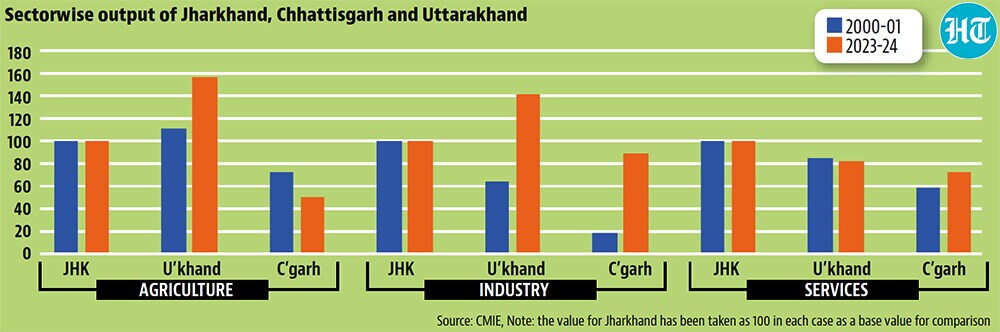
- How did Jharkhand fall behind?It is useful to look at the sector-wise mechanics of Jharkhand’s loss of economic advantage vis-a-vis the other two states. A broad-brush classification of agriculture, industry and services shows the following: Jharkhand’s agriculture component of GSDP in 2000-01 was 0.9 and 1.4 times that of Chhattisgarh and Uttarakhand. This has changed to 0.6 and 2 times respectively in 2023-24. For industry, these numbers were 1.5 and 5.6 in 2000-01 and they became 0.7 and 1.1 in 2023-24 respectively. For services, the numbers were 1.2 and 1.7 times of Chhattisgarh and Uttarakhand in 2000-01, and they were 1.2 and 1.4 in 2023-24, respectively. This shows that the main reason for Jharkhand’s falling behind Chhattisgarh and Uttarakhand is industry. Agriculture’s share in Jharkhand’s GSDP is a mere 11.5% compared to 44.1% for industry as of 2023-24.
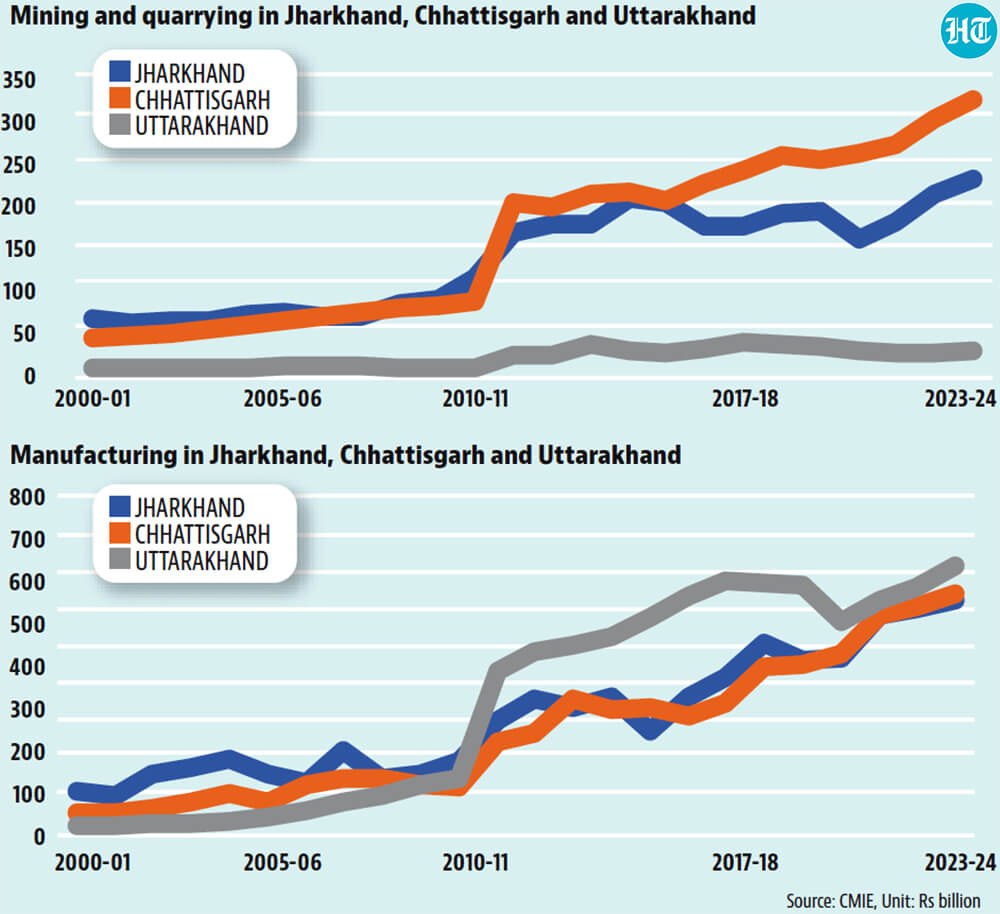
- Jharkhand’s industrial decline is a function of both mining and manufacturing underperformanceBecause the industry component of GSDP includes both manufacturing and mining -- both of which were important economic activities when Jharkhand was created -- it is useful to compare their separate trajectories to Jharkhand’s overall underperformance vis-a-vis Chhattisgarh and Uttarakhand. Jharkhand was ahead of both Chhattisgarh and Uttarakhand in terms of both manufacturing and mining value added in 2000-01. By 2023-24 it was behind both these states in manufacturing and had fallen behind Chhattisgarh in mining too. The ongoing election campaign in Jharkhand, like in most states, is dominated by competing promises of more welfare benefits by the two main alliances. Neither of the two sides has a clear articulation of how to bring about a rejuvenation of Jharkhand’s industrial landscape. To be sure, this might not be an easy task . Jharkhand’s initial leadership in manufacturing was organically connected with the industrialisation push of the newly independent Indian state, along with, of course the investment by the Tata group. With public sector manufacturing footprint in decline, Jharkhand’s manufacturing stock is more likely to go down rather than up.