E-Paper



Number Theory: India’s consumption inequality in 3 charts
The biggest difference between the expenditure of the top 5% and bottom 5% in rural India was seen in the consumption of second-hand durable goods.
Published on: Jun 12, 2024, 08:39:24 IST

 Prefer HTon Google
Share via


Copy link

The release of the 2022-23 Household Consumption Expenditure Survey (HCES) will give much-needed information on the pattern of household consumption expenditure in India after more than a decade. As has been pointed out in these pages, a change in the survey design between the latest and previous surveys means caution has to observed while making comparisons. The academic debate on comparability or lack of it between the latest and previous surveys is expected to start once independent economists start using the HCES unit-level data to reach their own conclusions.
That said, the numbers given in the latest HCES can give us a glimpse into the nature and extent of India’s consumption inequality. Here are three ways to look at it.
India’s consumption inequality in 3 charts
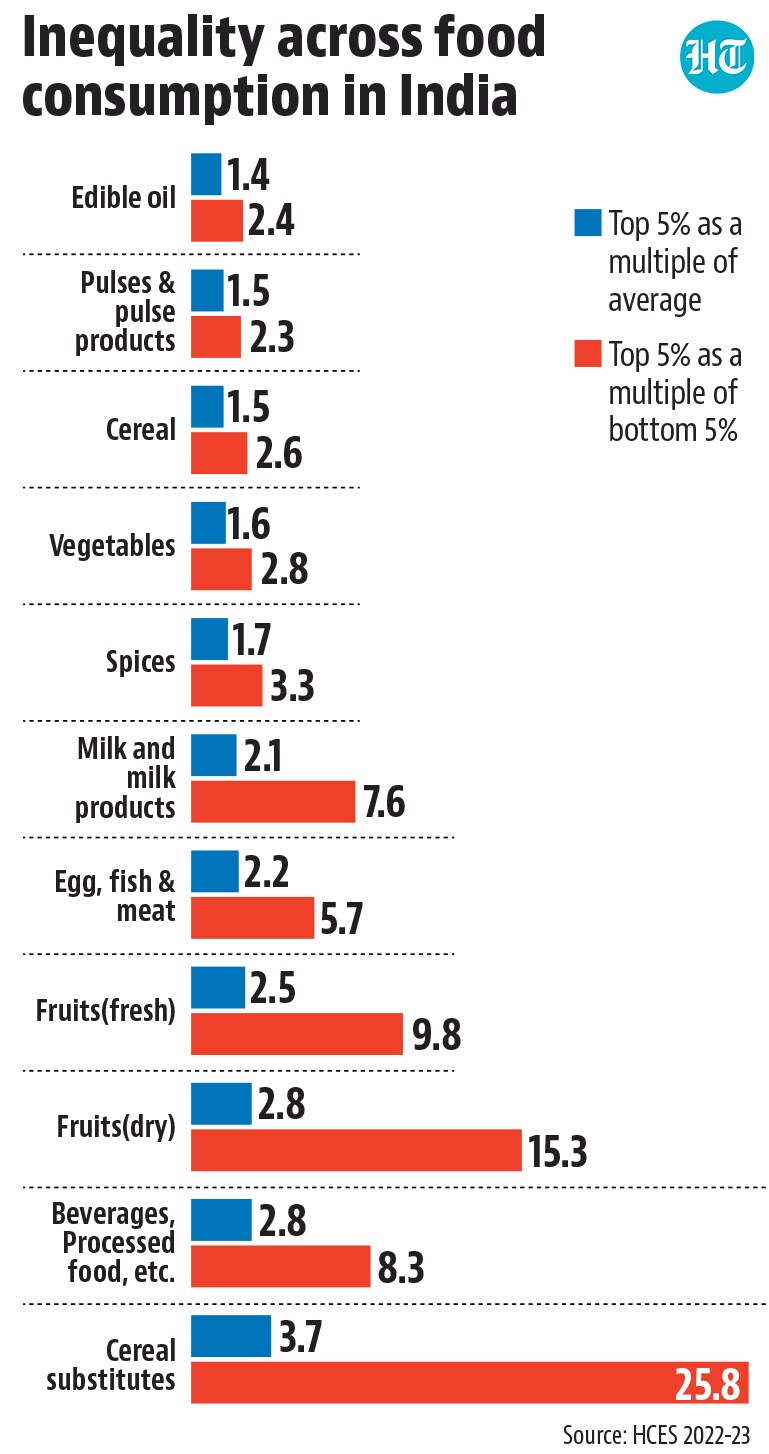
 How different are the food baskets of the rich and the poor in India?The average monthly spending on food is 47.5% and 39.7% of total spending in rural and urban India according to the 2022-23 HCES. In absolute terms these numbers are ₹1,749.91 and ₹2,529.67 respectively. What does HCES tell us about the food baskets of the really rich and poor in the country? HT has tried to answer this question by looking at absolute spending for food items for the lowest (bottom 5%), highest (top 5%) and average population in rural and urban areas. The overall food spending of the richest 5% (more on this later) is 2.1 times the average food spending and 4.9 times the food spending by the poorest 5% in rural areas. In urban areas, the richest 5% spend 2.5 times the amount spent by the average value and 6.1 times the food spending by the poorest 5%. To be sure, there is a large divergence between the class differential in spending within the food basket. Being rich or poor has a much lower impact on spending on cereals than it has on things such as dry fruits or cereal substitutes. To be sure, it needs to be kept in mind that what is shown as the top 5% in the HCES is not really representative of even the so-called middle classes in India. For example, the HCES gives ₹6,225.8 as the monthly per capita spending on food for the top 5% of households in urban India, which comes to ₹207.5 per day. This is less than what a single cup of Starbucks Coffee costs in any Indian city, not to speak of meals in expensive restaurants. This underlines the fact that the HCES either really does not even cover the relatively rich or they underreport their food spending.
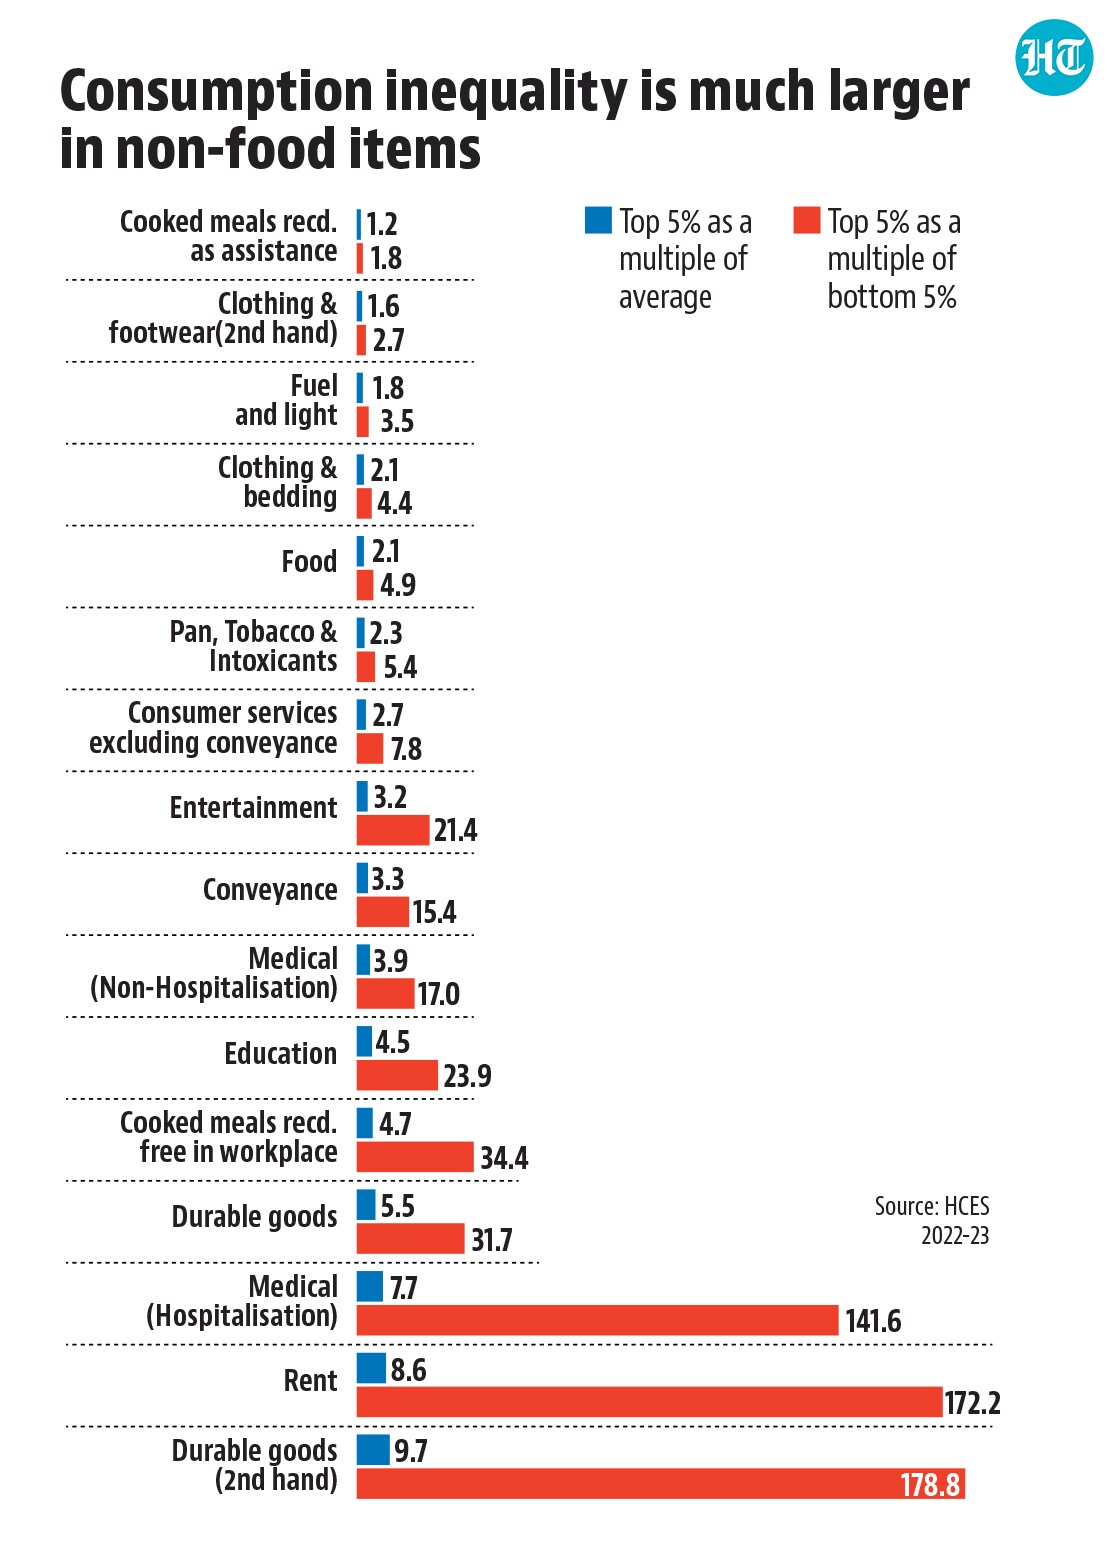
- Food is among the least unequal items of consumption: HCES 2022-23To be sure, consumption inequality is much larger when it comes to spending on non-food items. In absolute terms, the average non-food spending is ₹2,023.14 and ₹3,929.03 on a monthly per capita basis in rural and urban areas respectively. The average monthly expenditure on non-food items by the richest 5% in rural India is 3.4 times higher than the average, and 11 times higher than that of the poorest 5%. For urban areas, the difference is even greater, with the richest 5% spending 3.7 times more than average spending and nearly 15 times more than the poorest 5%. The biggest difference between the expenditure of the top 5% and bottom 5% in rural India was seen in the consumption of second-hand durable goods at 178.8 times, while the urban differential was highest for rent at 124.4 times. Free cooked meals received in workplaces, medical bills for hospitalisation, and education are some other non-food items for which a large difference in spending is noticed between the richest 5% and the poorest 5%.
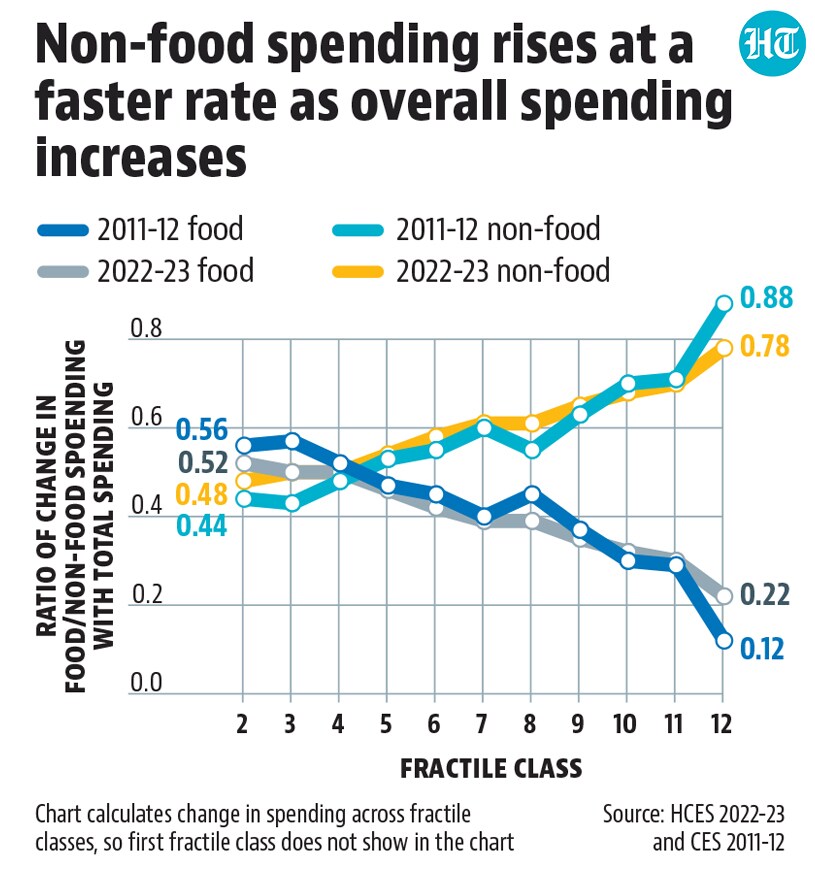
- How does consumption change from the rich to the poor?Basic economics tells us that as a person’s income increases, their consumption is likely to shift from essential commodities and primarily food items to more discretionary spending. How significant is this shift? This can be answered using the HCES data to calculate a proxy of marginal propensity to consume -- a measure of how a person’s consumption changes with respect to their change in overall monthly per capita expenditure (MPCE) – for food and non-food items across fractile classes given in the HCES report. For food items, the proportionate increase in spending becomes smaller as overall MPCE rises. For non-food items, the trend works in the opposite direction. This relationship has not changed much from what it was in the 2011-12 consumption expenditure survey. To be sure, the absolute value of money spent on all items continues to increase with a rise in income in both rural and urban India.