E-Paper



Number Theory: Is El Niño's influence on monsoon rains waning?
El Niño conditions are declared when Oceanic Niño Index is bigger than 0.5 and La Niña conditions are declared when it is smaller than -0.5.

 Prefer HTon Google


The El Niño-Southern Oscillation (ENSO) — a periodic warming (El Niño) and cooling (La Niña) of the equatorial Pacific Ocean — is the rare meteorological phenomena that has captured the attention of not just scientists but also historians, even common people. The biggest reason is its impact on rainfall in large parts of the world, including India. While El Niño is expected to dry up the June-September monsoon season, La Niña monsoons — the two terms are literal translations for Little Boy and Little Girl in Spanish — are expected to be rainier. However, scientists are now arguing that the link between what happens in the Pacific Ocean and India’s rainfall might be becoming weaker To be sure, the weakening relationship will not lead to rains being less volatile, only that they would likely be driven by other factors.
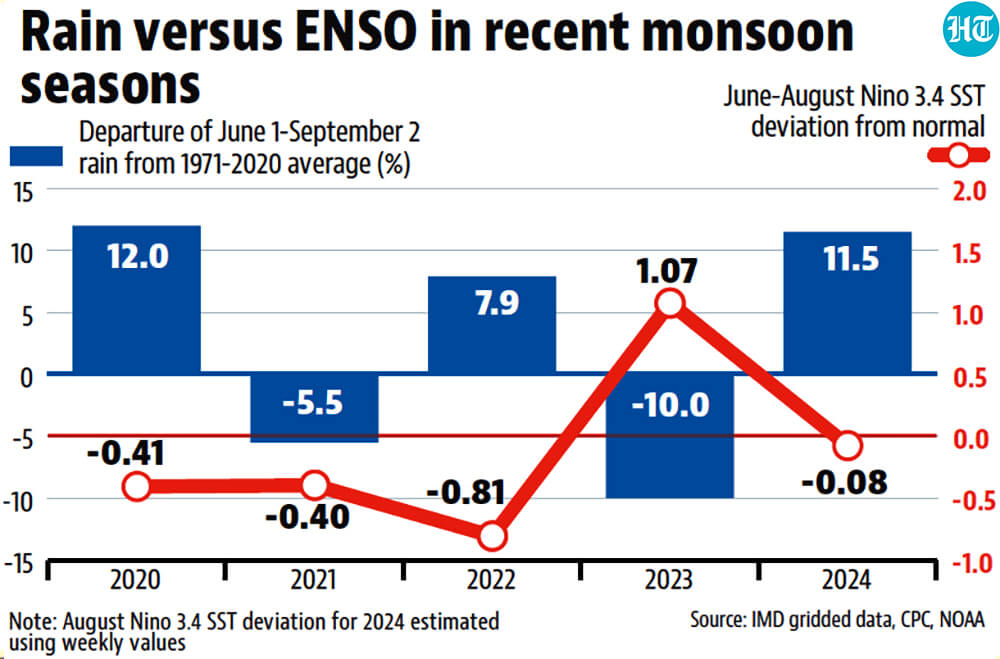
 El Niño, La Niña phenomena do not explain rain in some recent monsoon seasonsENSO conditions are detected from sea surface temperatures (SST) in the equatorial Pacific. A popular index used for this is the Oceanic Niño Index (ONI). ONI is simply the deviation of SSTs in the Niño 3.4 region (5˚N-5˚S, 120˚W-170˚W) averaged over a three-month period. El Niño conditions are declared when ONI is bigger than 0.5 and La Niña conditions are declared when it is smaller than -0.5. However, the 2024 monsoon appears to defy this theory. The preliminary numbers suggest the June-August ONI to be around -0.08, which is a neutral ENSO condition. Yet, the rain so far this monsoon is the 14th highest since 1901, according to the gridded data of the India Meteorological Department (IMD). To be sure, 2024 is not the first such year. The June-August rain in 2020 and 2021 was also very different despite nearly identical June-August ONI in both years.
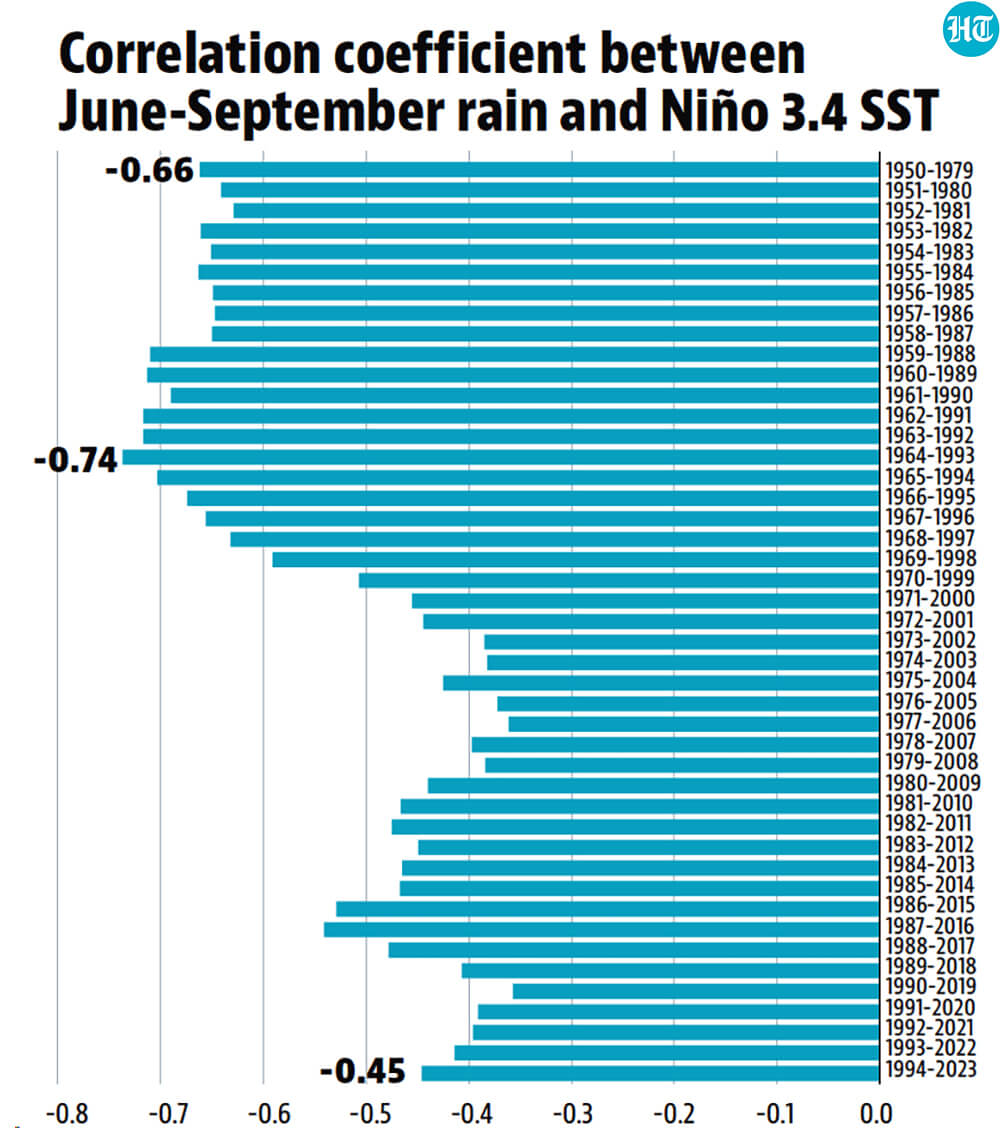
- This could be because ENSO’s correlation with monsoon in India has weakenedHow do we know ENSO is correlated with monsoon rain at all? In mathematics, a correlation between two numbers is seen by a number called correlation coefficient. This number varies between 1 and -1. Values 1 and -1 indicate a perfect positive and negative correlation, and 0 indicates no correlation. For the Niño 3.4 SST and monsoon rain in the 1950-2023 period, the correlation coefficient is -0.56. This is how we know that there is a reasonably high negative correlation between the two numbers. In simple English, a warmer Pacific Ocean, or a part of it, leads to a weaker monsoon and the cooler one, brings more rains. Has this relationship remained the same over the years? A 2023 paper published in Nature (https://tinyurl.com/jf7yh86b) by K S Athira and others looked at rolling 30-year periods, a duration often used to define the climate of a place. For example, they looked at the correlation coefficient in the 1901-1930 period, the 1902-1931 period, and so on until the 1981-2018 period. HT has replicated this process for the years from 1950 to 2023. This shows that the correlation coefficient hovered between -0.6 and -0.7 from the 1950-1979 period to the 1968-1997 period. After this steady period, it has been falling and stood at -0.45 for the 1994-2023 period. Once again, this simply means that the relationship between ENSO and Indian monsoon is still there, but weaker than it was in the past.
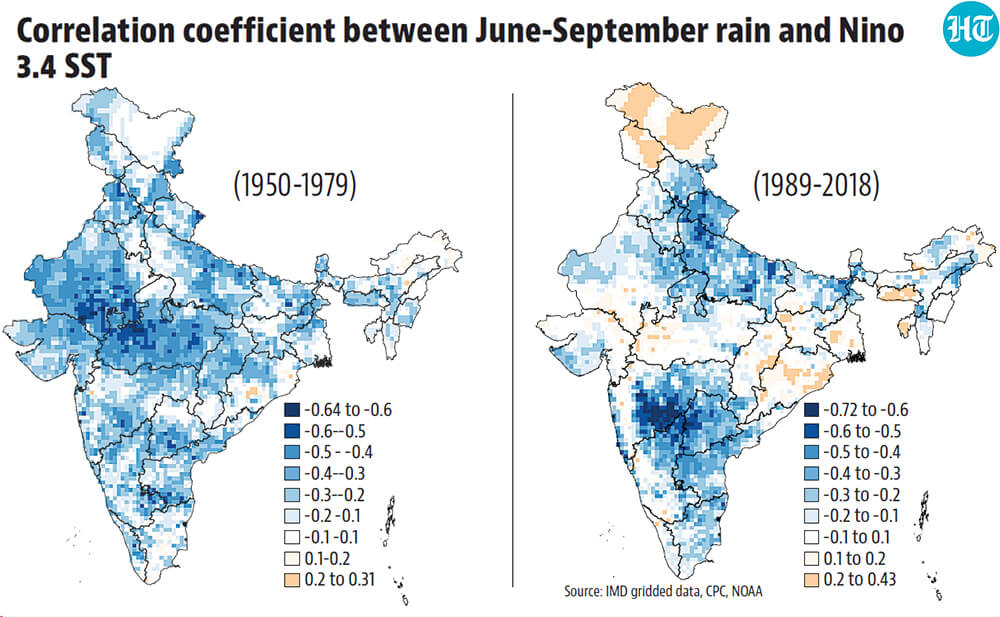
- To be sure, this correlation has not evolved in the same way for all parts of IndiaThe researchers tested for such regional differences by running similar calculations for three different regions: north (71˚E–84˚E, 27˚N–31˚N), central (72˚E–89 ˚E, 21˚N–26˚N) and south India (73˚E–81˚E, 13˚N–19˚N). While the northern and southern regions analysed show an increasing and steady relationship with ENSO, respectively, the central region shows a decreasing relationship. In the last period analysed by the researchers (1980-2018), this correlation coefficient for the central region had decreased to near zero. To be sure, this is the aggregate trend for these regions. Individual places within those regions can still show somewhat different trends. This can be seen in the accompanying maps.
- What explains annual variation in monsoon rain , then?ENSO was not the only driver of monsoon even earlier. It is just that it used to be the more dominating factor. With its influence waning in central India, other factors have taken over. For example, inter-year rain variations in central region are now explained by inter-year variations in monsoon troughs (an elongated low-pressure area that causes rain during the season) and depressions (cyclone-like low pressure areas but with lower wind speeds than cyclones), Athira told HT.