E-Paper



Number Theory: US polls and three key demographic factors
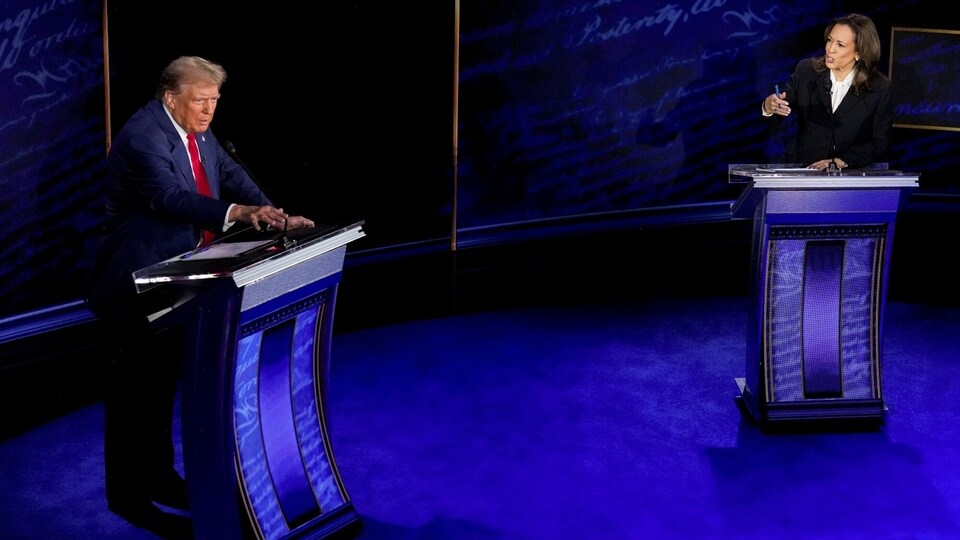
Polls suggest a razor-thin race between Democratic nominee Kamala Harris and Republican nominee Donald Trump
Updated on: Oct 26, 2024, 14:46:48 IST

 Prefer HTon Google
Share via


Copy link

The US presidential election is just 10 days away, and polls suggest a razor-thin race between Democratic nominee Kamala Harris and Republican nominee Donald Trump. With the outcome hinging on even the smallest shifts, what trends could tip the scales? The charts below highlight three critical factors to watch in this high-stakes contest.
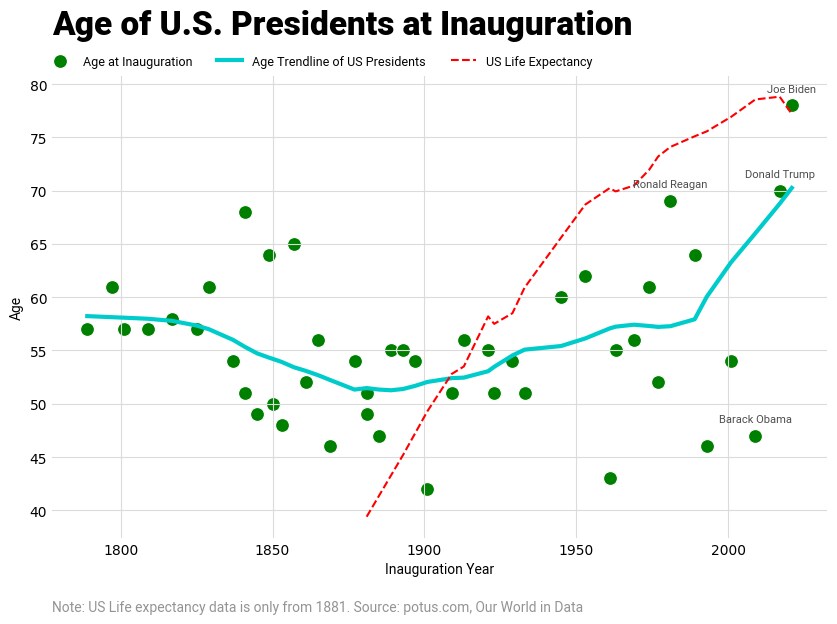
 How old is too old for POTUS?A 2023 Pew Research Center survey found that nearly half of Americans (49%) prefer a President in their 50s, while 20% prefer even younger candidates. How old have US presidents been? The oldest and youngest have been Joe Biden, who was 78 at the time of inauguration of his presidency, and Theodore Roosevelt, who was 42. The median age of all US presidents on the day of their inauguration is 55 years. Donald Trump was 70 when he took office in 2016. If Trump, now 78, is re-elected, he would again be the oldest president in US history as he will be five months older than Biden when he became the President in 2020, a fact that Harris has used against him over recent weeks. To be sure, had Biden, who is now 81, not pulled out of the race, the too-old-to-run shoe would have been on the Democratic rather than on the Republican foot. Harris, meanwhile, recently turned 60, which is also above the median age. Does this mean that US presidential candidates are getting progressively older? Although past centuries saw some of the oldest US presidents and recent history has included some of the youngest—Barack Obama was 47 when he became the President in 2009—the age trendline of POTUS has curved upwards, especially with the presidencies of Trump and Biden. This also needs to be viewed along with the rising life expectancy in the US, which has increased from 39.4 years in 1881 to 77.2 years in 2021.
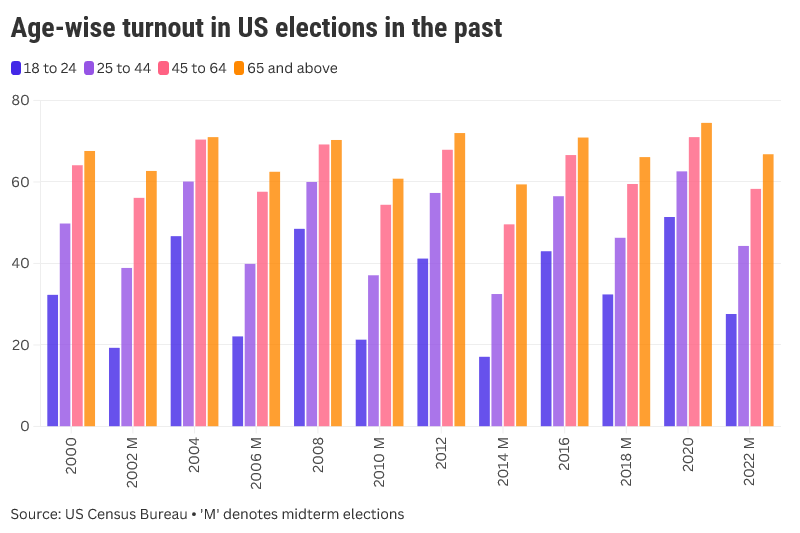
- Will the youth come out to vote?With polls predicting a tight race in several states, the youth vote could be crucial. Younger voters (18-30) have strongly favoured Democrats in recent elections, with over 60% backing Obama in 2008 and 2012, and Joe Biden in 2020. However, youth turnout remains low, averaging just 43.9% in presidential elections since 2000 among those aged 18 to 24 years, compared to 68.2% for voters aged 45 to 64, and 71.1% for those 65 and older. Boosting youth turnout, as seen in 2020, will be key for the Democrats. In Georgia, for instance, the surge in young voter turnout is largely seen as the key factor that swung the state to Biden in 2020, with the margin of victory just 12,000 votes. The 2020 election also saw the highest turnout among younger voters. To be sure, younger voters seem to be less sure about whom they support in 2024. A recent poll by The Economist/YouGov shows that 58% of those below 30 plan to vote for Harris and 37% for Trump. However, only 49% of those in the same age bracket view Harris favourably, while the figure stands at 43% for Trump, indicating that a significant section of young voters aren't too enthusiastic about either candidate.
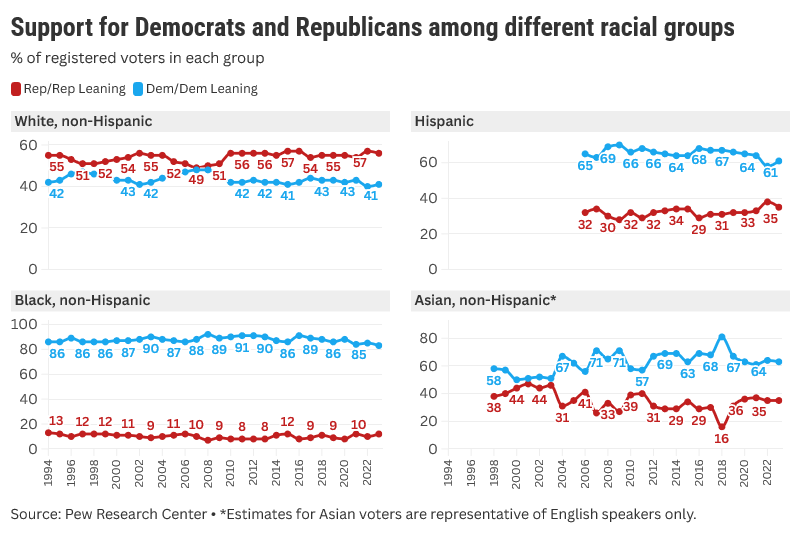
- How have demographic changes impacted US political matrix?Racial and ethnic diversity, driven by immigration and higher minority birth rates, has reshaped US demographics and politics. The White voter share, largely Republican-leaning, dropped from 85% in 1985 to 67% in 2023, while Black and Hispanic voters rose to 11% and 13% respectively. Both parties have diversified, but Democrats have seen a greater shift. Data from Pew on racial and ethnic diversity within the parties shows that the share of registered White Republicans and Republican-leaning voters in the GOP fell from 93% in 1996 to 79% in 2023. Meanwhile, Hispanic representation tripled to 9%, and Black and Asian voters in the coalition are at 3% each. In the Democratic coalition, share of registered White Democrats and Democratic-leaning voters dropped from 77% in 1996 to 56% in 2023, with Hispanic and Asian voters rising to 16% and 6%. Black voters remain stable at 18%, though with a slight recent decline. As the White majority in the US declines, Republicans have maintained their base by increasing White voter turnout, which remains higher than other groups. They've also gained ground among Hispanic and Black voters in recent years, with nearly 35% and 12% of them identifying as Republicans, as can be seen from Chart 3. The GOP’s ability to expand its base among minority groups will play a crucial role in shaping this year's election outcome.