E-Paper



Number Theory: Worldwide record rain spread hits fresh highs
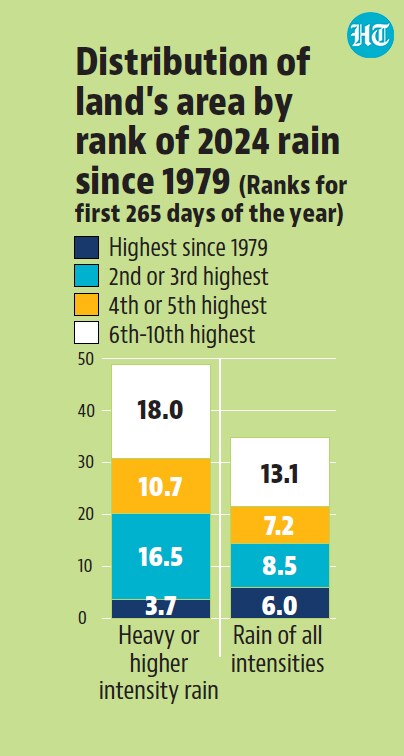
If all rain – including lower intensity rain – is taken into account, 6% of the land has recorded the highest rain since 1979.
Published on: Oct 2, 2024, 09:02:13 IST

 Prefer HTon Google
Share via


Copy link

The floods in central Europe earlier this month, in the United States, and now in Nepal are only the latest floods reported across the globe this year. Is it unusual for floods to occur across the world in a single year? Answering this question is difficult because a time-series mapping of floods is difficult, as HT explained earlier this month. However, it is relatively easier to track the usual factors behind floods: high intensity rain, built-up area, and their interaction. HT’s analysis of these factors shows that flood vulnerability is high for an unusual expanse of land this year. Here is how.
Worldwide record rain spread hits fresh highs
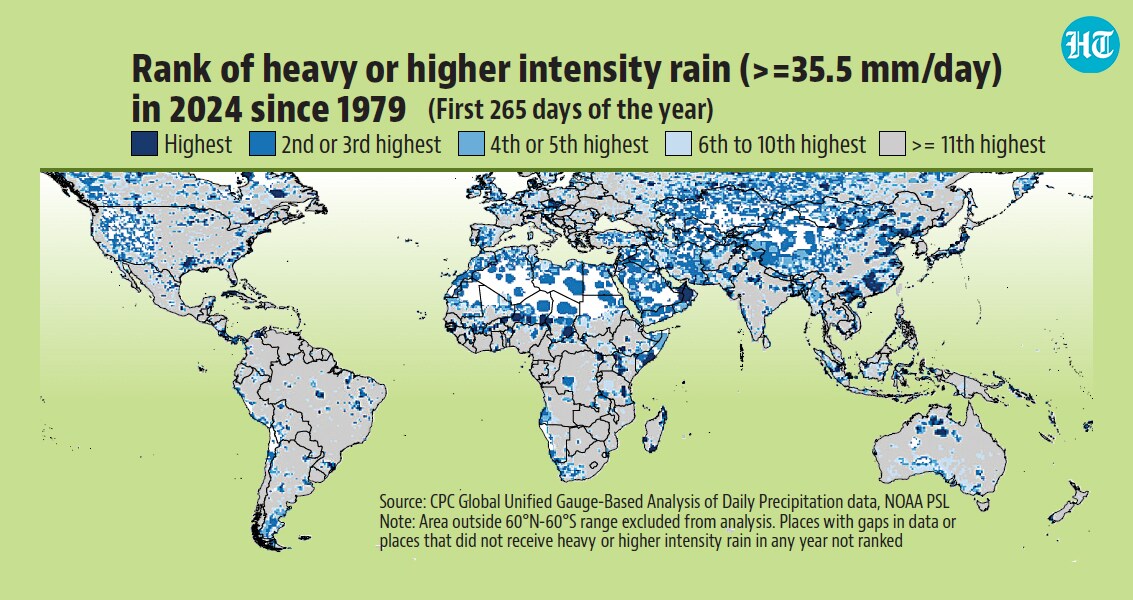
 The spread of high intensity and total rain is among the highest in four-and-a-half decadesSince it is not feasible to track floods, HT analysed the amount of heavy or higher intensity rain that different places have received since 1979, the earliest year in the Climate Prediction Center (CPC) Global Unified Gauge-Based Analysis of Daily Precipitation. Since there are no globally accepted thresholds of intense rain, HT used the threshold used by the India Meteorological Department (IMD) for heavy or higher intensity rain: rain of 35.5 mm or more at a place in 24 hours. To be sure, this threshold may at times represent a higher intensity in CPC’s data than in IMD’s data. While IMD’s gridded data is for boxes bound by two latitudes and longitudes 0.25 degrees apart, CPC’s data is available at a coarser 0.50 degrees resolution. This means that a CPC grid will show 35.5 mm rain even if half of the grid receives 50 mm and another half 21 mm. Despite this, the CPC data shows that 20.2% of the land between the 60°N and 60°S latitudes (the land beyond this region is sparsely populated) has received heavy or higher intensity rain ranked highest to third highest since 1979 for the first 265 days of the year (the period up to September 20 or 21). This is the second highest spread since 1982 of such a large amount of intense rain. In 3.7% of the land area, such intense rain is the highest since 1979. This coverage of record-breaking rain is the third highest in 2024 after 1982 and 2022.
- If all rain – including lower intensity rain – is taken into account, 6% of the land has recorded the highest rain since 1979.
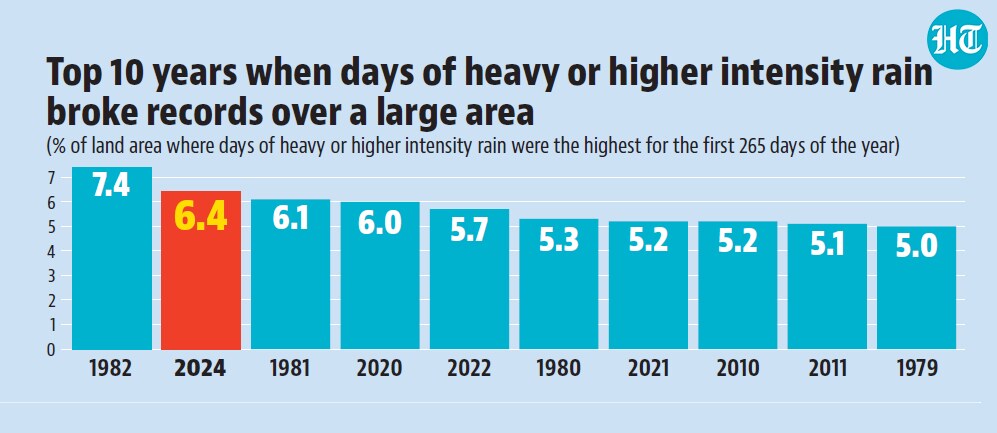
- A larger fraction of land has received heavy or higher intensity rain for a record number of daysThe amount of intense rain is a good metric for checking rain’s role in floods, but not the only one. A place that receives intense rain on more days will be vulnerable to floods on more occasions, although the floods may be less dangerous if the amount of rain is less skewed. CPC data shows that this metric – days of heavy or higher intensity rain – has broken records over a larger area of land. The number of days of such rain was the highest since 1979 for the first 265 days of the year over 6.4% of land (more than the 3.7% area covered by record-breaking amount). This is the second-highest coverage of such area for any year since 1979.
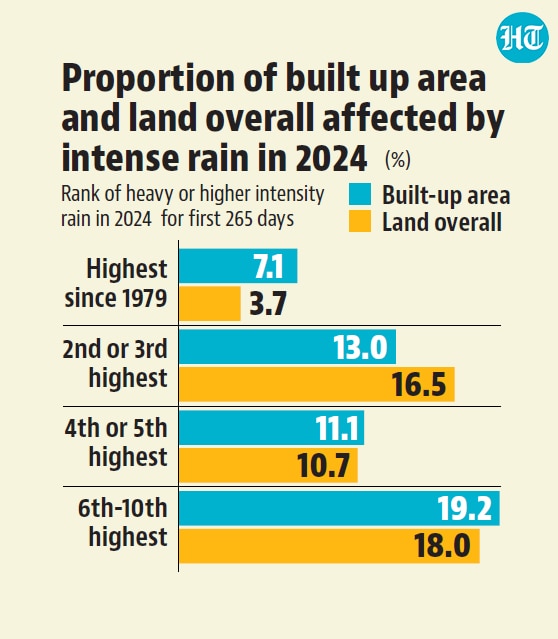
- Rain records were broken over a larger proportion of the built-up area than overall landAll land that receives intense rain is not equally vulnerable to floods. Intense rain over a built-up area is more likely to cause floods than when it falls over a forest. This is because concretisation decreases the ability of land to absorb water and can also decrease surface run-off by blocking natural and man-made drainage systems. Therefore, HT also checked how much built-up area – as available from the Global Human Settlement Layer (GHSL) project – received record-breaking intense rain. This shows that the proportion of built-up area where intense rain’s records were broken is higher than the proportion for land overall. To be sure, since GHSL data is available only at five-year intervals, this analysis was performed using the 2020 built-up area and is likely to be an underestimate.
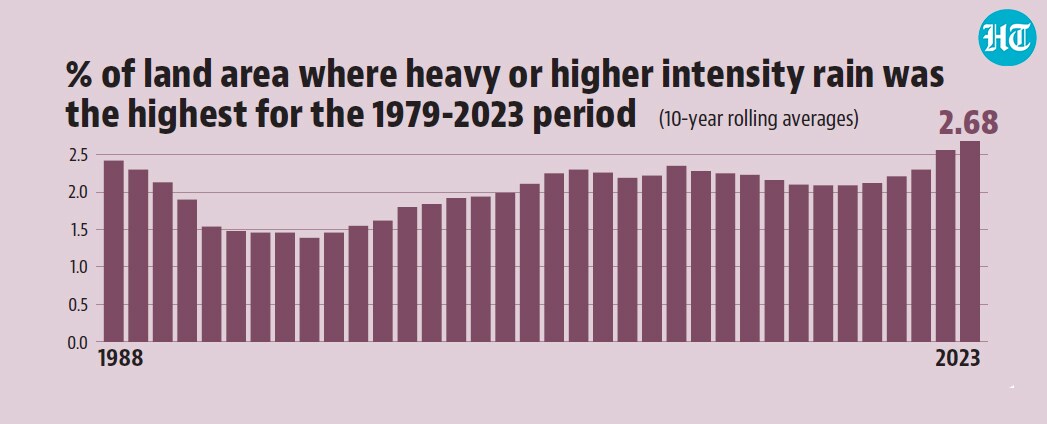
- All these vulnerabilities to flood have expanded their coverage over timeFor example, the built-up area that record-breaking intense rain covered in 2024 is 2.8 times the area that the exact same regional pattern of intense rain would have covered in 1980. Some of this is just the result of the fact that global built-up area is now 2.4 times that it was in 1980. However, intense rain is also breaking records over a larger area now than earlier. This can be seen in the ten-year rolling averages of the share of land covered by record-breaking intense rain. In the decade ending 2023, such area was the highest. Clearly, when 2024 ends, it may not be the last year when floods have affected a large part of the world.