The official monsoon season that runs from June 1 to September 30 ends today. According to IMD’s gridded data – the only dataset that allows one to look at rainfall long term – the level of rain this monsoon is likely to rank 48th highest. However, an HT analysis shows that there is good reason to look beyond the headline rainfall number, both absolute and relative, for this year’s monsoon. Here is why.
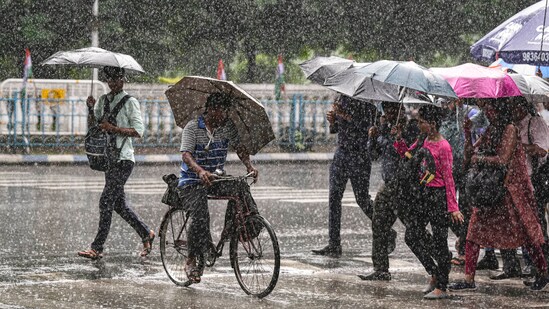
Why headline numbers don’t explain the 2025 monsoon
- Overall, this monsoon is the 48th rainiest since 1901According to IMD’s gridded rainfall data India received 892.4 mm rain up to September 29. This is the 48th highest rain for the season since 1901, the earliest year for which IMD has published gridded data, if the last day of the season is left out. The cumulative monsoon rainfall in 2025 as of September 29 is 4.6% more than the 1971-2020 average, which the IMD currently considers as the Long Period Average (LPA) for tracking rain levels. To be sure, the surplus figure is somewhat higher in IMD’s published reports (8% up to September 28). This difference could stem from several reasons. One important reason is just that the method of averaging rain for a particular region in the published report differs slightly from the gridded data.
- Some of the trends in the headline number could be because of its early arrivalOne reason why the 2025 monsoon does not look very wet is that the weather systems associated with the season arrived much before June 1. The monsoon arrived at the Kerala coast this year on May 24, eight days before its June 1 schedule. It was the fifth earliest arrival since 1971, the earliest year for which comparable data is available. However, it did not progress beyond peninsular India and north-eastern states just as fast. This meant a dry period in the first half of June. Of the 28 days this season when daily rain had a deficit of 20% or more, nine days are in the period from June 6 to June 14. If the 59 mm cumulative rain from May 24 to May 31 had fallen in this dry period in June, this monsoon would be ranked the 14th wettest. To be sure, it wasn’t the case that the month of June was dry overall. In fact, it recorded a 9% surplus. At a monthly level, only July had a deficit (7.3% over the LPA) this monsoon season. August and September not only had a surplus on a monthly basis but even in terms of day-to-day rain. These two months had just six and three days when daily rain’s deficit was 20% -- the threshold for deficient rainfall in the IMD framework-- or more.
- The geographical skew in intense rain is also masking the disaster potential of the 2025 monsoonThis year’s monsoon season has seen many rainfall/flooding related incidents. What explains such mishaps in a monsoon with a relatively modest surplus? One reason why the 2025 monsoon’s rank does not capture its disaster-causing potential is the geographical skew in intense rain, taken here as more than 35.5 mm rain in a grid in 24 hours (IMD’s threshold for “rather heavy” rain). If this looks like a low threshold, that is because of two reasons. One reason is that this is the threshold for the lowest level of intense rain. Another reason is that IMD’s rainfall grids are around 28 km long and wide and can miss small regions of intense rain. For example, of nine stations which recorded rain on July 10 in Delhi, one recorded 105.5 mm rain and three others recorded more than 60 mm rain. However, the rain at different stations averaged out such that the wettest grid passing through Delhi recorded just 51.4 mm rain on the day. Intense rain was within 20% of the LPA – IMD considers this level of deviation “normal” for local rain -- in only 20.3% of the country’s area. Intense rain had at least a 20% surplus in 39.5% of the country and a deficit of at least 20% in another 39.5% of the country. This means that intense rain was geographically skewed towards extreme trends, with the extreme surplus regions vulnerable to disasters. This is less so the case if one looks at rain of all intensities together: 41.6% of the country received normal rain overall; 37.4% had a surplus of at least 20%, and 21% had a deficit of at least 20%. This is an important reason why overall the monsoon surplus looks modest despite regular floods and landslides in this season.
Unlock a world of Benefits with HT! From insightful newsletters to real-time news alerts and a personalized news feed – it's all here, just a click away! -Login Now!
Unlock a world of Benefits with HT! From insightful newsletters to real-time news alerts and a personalized news feed – it's all here, just a click away! -Login Now!
Advertisement
{{/htLoading}}{{#usCountry}}