The most widely quoted count of farm fires in Punjab and Haryana is taken by Nasa satellites that pass overhead. For years, the method was reliable: the MODIS and VIIRS instruments on Nasa's satellites can pick out a fire on a patch of ground as small as 1 km and 375 metres across, respectively. Since 2022, that has changed. Several analyses have established that the drop in detections, from 84,240 fires in the 2021 season to 4,824 in 2025, is largely because farm fires now happen after the Nasa satellites have passed.
An HT analysis of fire detections by INSAT-3DS, India's own weather satellite, now shows how much of this season's Diwali surge that count missed. By HT's estimate, the satellite's daily fire count in Punjab and Haryana rose 12.5-fold in the week to Nov 9, compared with the week to Nov 1. Nasa's count rose 2.4-fold over the same weeks. Here is what you need to know about the patterns, how the surge has played out this year, the effect on Delhi-NCR in recent days, and why putting a true scale to the problem is now challenging. (See Chart 1)
The pattern: Felds now burn after satellites pass
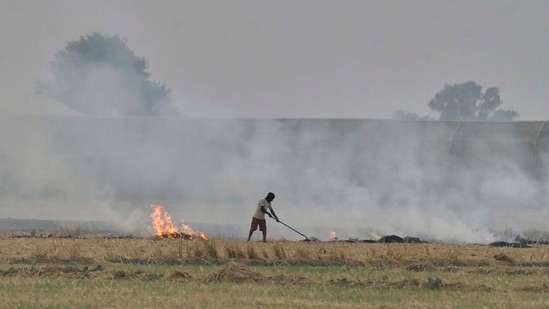
Every October and November, farmers in Punjab and Haryana burn the stubble left in their fields. The smoke reaches Delhi-NCR when the wind blows from the north-west.
Two kinds of satellite watch the fires. Nasa's fire-counting satellites circle the Earth from pole to pole and pass over Punjab twice a day, once in the early afternoon and once in the early hours of the morning. Two more satellites with the same instrument cross at almost the same times. A field set on fire at 4pm and burnt out by night never shows up in their count.
The second kind circles the Earth at the same rate as the Earth turns, which means it stays above the same spot and can watch the region all day. Europe's Meteosat is one, scanning every 15 minutes. India's INSAT-3DS, run by the Indian Space Research Organisation (ISRO), is another, scanning every half hour.
Meteosat measures fire heat, the energy that fires give off. HT's analysis of Meteosat data shows that in 2021, it saw 53% of the season's fire heat in Punjab and Haryana after 3pm. The share rose to 75% in 2022, 84% in 2023 and 94% in 2024, and reached 98% in 2025. Over the same years, the share in the hours of NASA's afternoon passes, 1pm to 3pm, fell from 40% to under 1%.
{{/usCountry}}Meteosat measures fire heat, the energy that fires give off. HT's analysis of Meteosat data shows that in 2021, it saw 53% of the season's fire heat in Punjab and Haryana after 3pm. The share rose to 75% in 2022, 84% in 2023 and 94% in 2024, and reached 98% in 2025. Over the same years, the share in the hours of NASA's afternoon passes, 1pm to 3pm, fell from 40% to under 1%.
{{/usCountry}}Nasa's Earth Observatory and the research group iFOREST have reported the same shift in their own analyses.
The burning itself has fallen far less than Nasa's count. HT compared Nasa's season counts with iFOREST's figures for the area burned. In 2025, the area burned in Punjab and Haryana was 81% of the 2021 figure, while Nasa's count was 6%. iFOREST measures the area burned from European Sentinel-2 satellite images, in which burnt fields show up whatever time of day they were burned. (See Chart 2)
Also read: Delhi pollution monitors went dark as AQI surged on Diwali
Hiren Jethva, who co-wrote Nasa Earth Observatory's analysis, wrote on X that actual fire counts for 2022 to 2025 were "multifold lower" because peak burning moved to the late afternoon, which MODIS and VIIRS do not sample. A South Korean satellite that stays above one spot did capture the daily pattern, he wrote.
How the surge has played out this year
HT counted the fires INSAT-3DS detected in Punjab and Haryana each day this season. The satellite counts fires differently from Nasa: each fire it detects is a patch of ground several kilometres across that is hot enough to be burning.
Until Oct 28, it saw almost no burning in the two states. From Oct 29, its count rose every day, from 18 to 447 on Nov 8, Diwali, the highest of the season. In the week to Nov 9 it averaged 301 fire detections a day, against 24 a day in the week to Nov 1. That is the 12.5-fold rise. On Nov 9 the count fell to 98, for reasons that are not known. (See Chart 1)
Nasa's count also peaked on Diwali, at 385 fires, but rose far less. It averaged 260 fires a day in the week to Nov 9, against 109 a day in the week to Nov 1, an increase of 2.4 times. The two satellites count different things, which is why HT compares only how fast each count grew.
This season, 98% of the fires INSAT-3DS detected in Punjab and Haryana came between 4pm and 6pm, well after Nasa's afternoon pass, which accounts for most of the gap. (See Chart 3)
Also read: New stations on periphery may be clouding AQI data in Delhi, HT analysis shows
The effect on Delhi-NCR in recent days
Smoke from the fields travels to Delhi on a north-westerly wind, blowing 1 km to 3 km above the ground. The India Meteorological Department's weather balloon, launched from Safdarjung in Delhi, measures that wind. It read 29 km/h on Nov 7. By Diwali afternoon the wind had eased to 15 km/h. By the early hours of Tuesday, Nov 10, it had dropped to 6 km/h and turned to blow from the north-north-east, no longer from the direction of the fields. (See Chart 4)
To see where Delhi's air had actually been, HT tracked the air reaching the city at 2pm each day back over the previous three days. It used wind data from two weather models, the US Global Forecast System (GFS) and the European Centre for Medium-Range Weather Forecasts' model (ECMWF). On Diwali, the air reaching Delhi had blown in across the fire belt, the farmland of Punjab and northern Haryana where most of the fires burn, passing over as many as 275 of the fires INSAT-3DS detected. On Nov 9 and Nov 10, it blew in from the east and north-east and passed none of them.
On Diwali, pollution over Delhi also had less room to spread. The mixing layer, the layer of air above the ground in which pollution spreads out and thins, was 364 metres deep that afternoon. Its usual depth in early November is about 1,300 metres.
The fires typically burn about 260 km from Delhi. By HT's estimate, the air reaching the city on Diwali afternoon had crossed most of them 30 to 35 hours earlier, as the wind was weak. At the faster winds forecast for this week, the same journey would take about 10 hours. The estimate tracks the air, and does not measure how much smoke it held.
The weather models expect the north-westerly to pick up again, to 27 km/h on Wednesday, Nov 11, and 23 km/h on Thursday, Nov 12. Both show the air reaching Delhi on Thursday afternoon crossing the fire belt. For Wednesday, they disagree. The European model has the air crossing the belt, while the US model, at about 800 metres above the ground, has it passing along the belt's edge. Near the ground, the models forecast light winds and no rain through Nov 16. Rain would wash some of the smoke out of the air. (See Chart 4)
HT Immersive | The smog Delhi can’t wish away
Why putting a true scale to the problem is now hard
HT cannot rank this season against earlier ones on fire counts. Nasa's satellites have missed more of the burning with each passing season, and a comparison with their past counts would mostly measure how much they missed. Isro's counts are not comparable from one season to the next.
Isro's satellite misses fires too. The patches it checks are several kilometres across, which means it flags only large or intense fires. It also cannot see fires under cloud or thick smoke. Its count of this season's surge is therefore lower than the true number of fires.
Jethva has offered one estimate of the season's scale. A statistical model that predicts the number of fires from how green the crop was, as measured by MODIS, "ranks 2026 Punjab-Haryana post-monsoon fire season as one of the intense burning periods", he wrote. The model expects about 14,000 fires this season, counted the way MODIS counts them.
The closest like-for-like measure across years is iFOREST's area burned, which does not depend on the hour of burning. HT does not yet have that figure for this season.