E-Paper



Number Theory: Economics of India's caste-wise inequality
The caste survey data, collected in two phases in Bihar this year starting January, was released on Monday, October 2.

 Prefer HTon Google


The publication of subcaste-wise population numbers from the Bihar caste survey has given a big boost to the demand for proportionate reservations across the country. While national Opposition parties including the Congress have raised this demand, Prime Minister Narendra Modi, while speaking in a rally in Chhattisgarh, accused the Opposition of playing divisive politics. Whether or not this demand will hurt the BJP or help the Opposition is a question best left to the future. It is, however, a good moment to look at caste-wise inequality in India. While we do not have such data on the subcaste level, it does exist at the level of four broad social groups – Scheduled Castes (SC), Scheduled Tribes (ST), other backward classes (OBC), and others. Here are four charts which explain some of these facts.
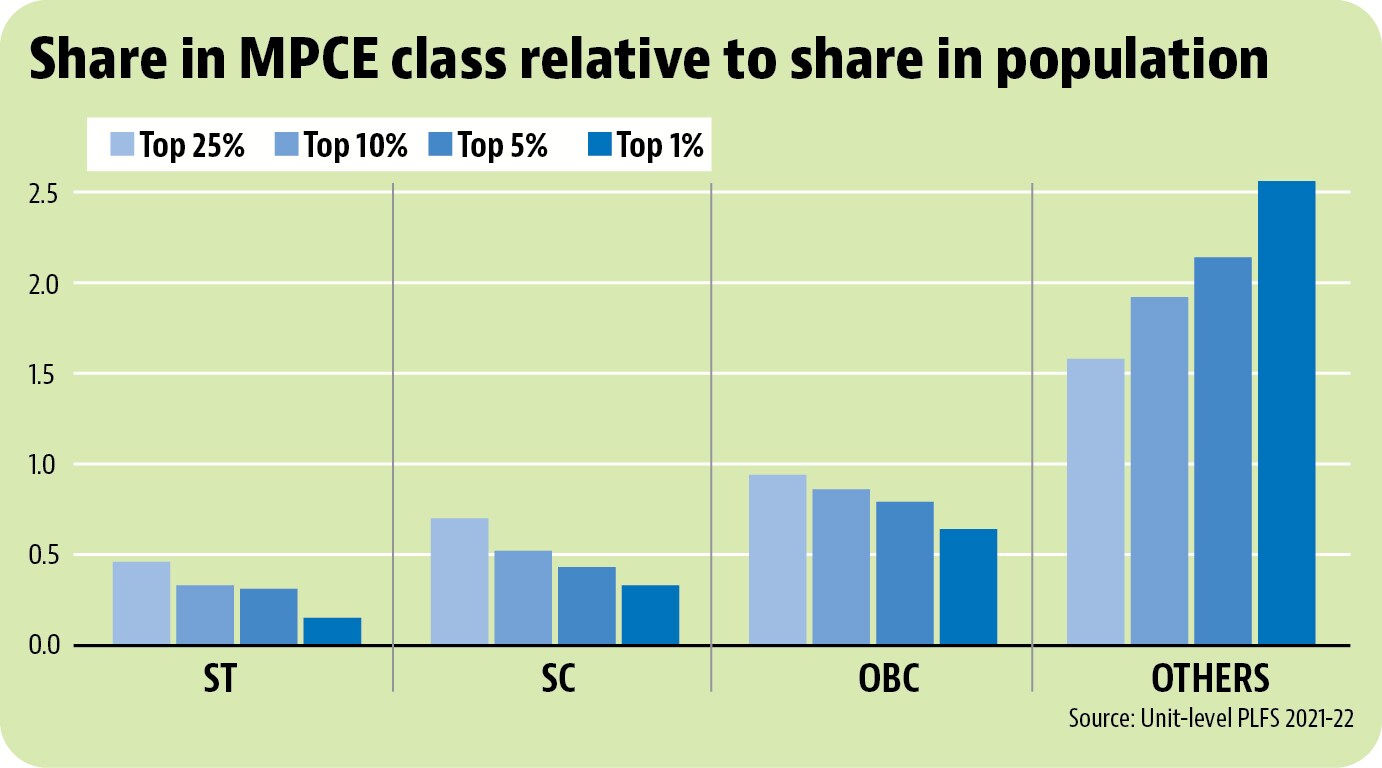
 Non-SC/ST/OBCs are the richest social group in IndiaThe 2019 All India Debt and Investment Survey (AIDIS) gives information about the total value of assets of broad social groups in India. An HT analysis of unit level data shows that the average value of total assets of a non-SC/ST/OBC household was ₹32,82,842 which is 1.8-3.3 times the average assets of SC, ST or OBC households. To be sure, asset value might be a reflection of inherited wealth as well, and therefore does not tell us the current state of inequality in the labour market. A comparison of monthly per capita expenditure (MPCE) levels for different social groups can help resolve this. Unit level data from the latest Periodic Labour Force Survey (PLFS) shows that non-SC/ST/OBCs have a much bigger share in higher MPCE brackets than their share in population while the opposite is true for the SC/ST/OBC population. This advantage increases with rising MPCE levels. To be sure, it needs to be kept in mind that samples such as PLFS do not include the really rich in India.
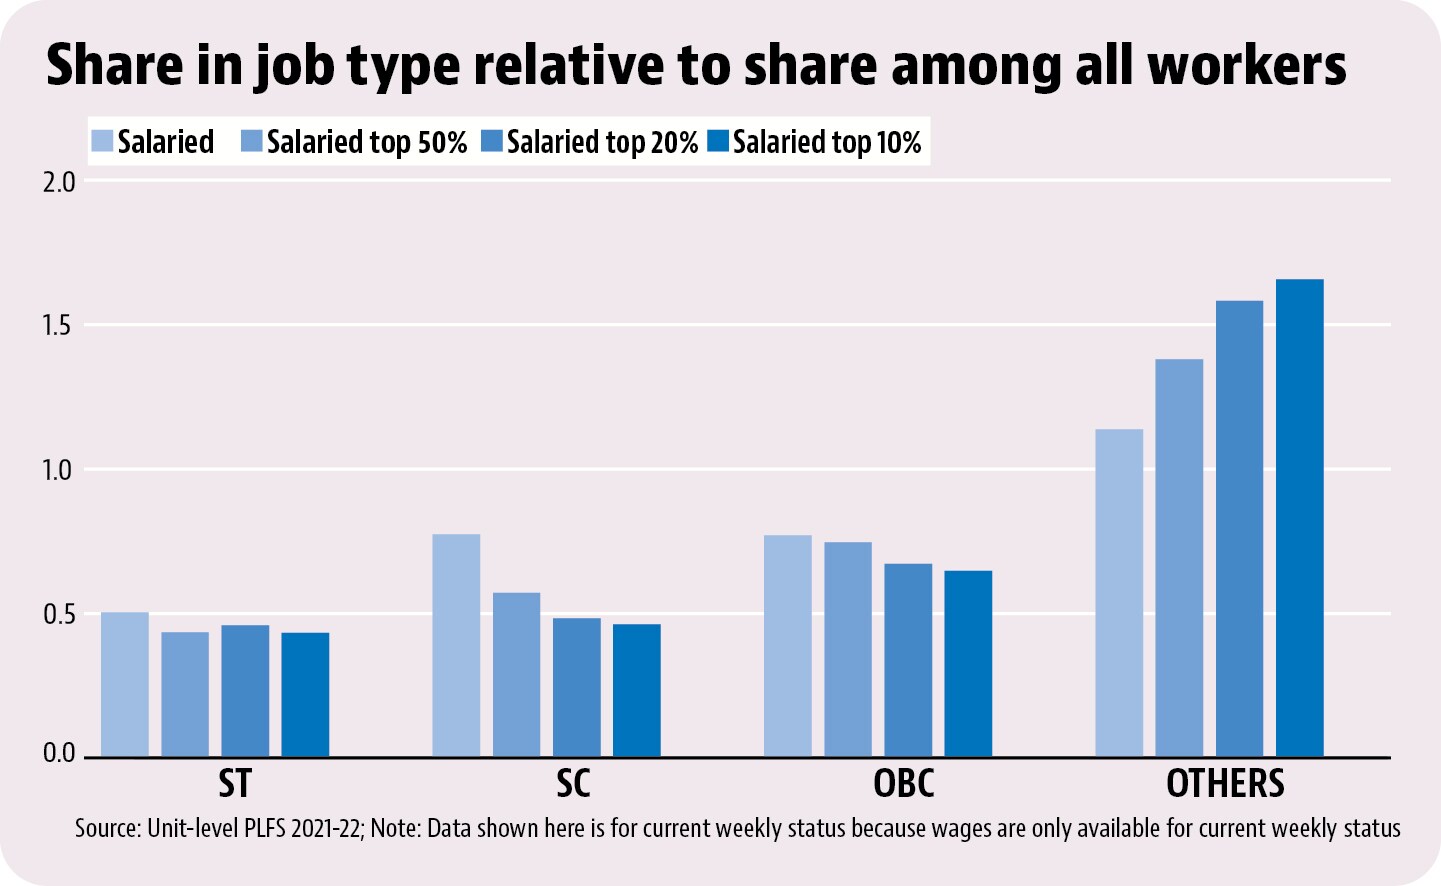
- Advantage of non-SC/ST/OBCs is seen in their representation in high-income jobsRegular wage/salaried jobs have the best income levels in India. An HT analysis of the latest PLFS data shows that not only do non-SC/ST/OBC workers have a higher relative share in salaried jobs, their advantage increases with salaries. Relative share here throughout the rest of the analysis is the share of the group in that work status relative to the share among all workers.
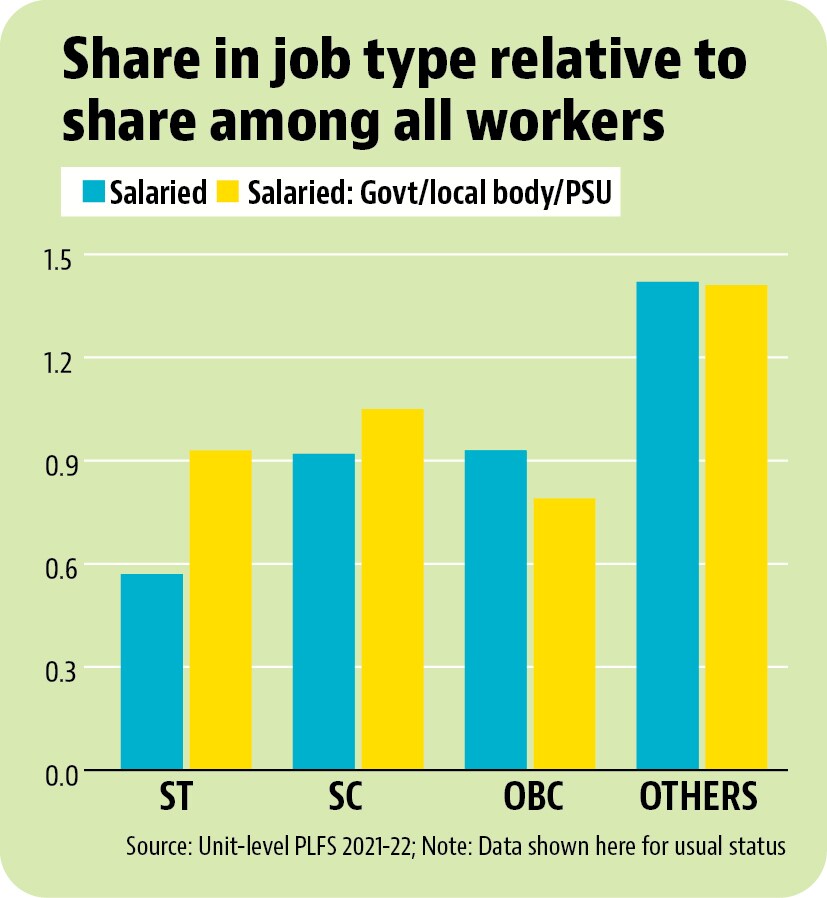
- Inequality in government jobs is lower for SC/ST groupsPLFS data allows a separate classification of government jobs. The analysis shows that the relative share for SCs and STs in government salaried jobs is higher than overall salaried jobs. For OBCs, the relative share in government salaried jobs is lower than overall salaried jobs. And for non-SC/ST/OBC workers, too, the advantage in government salaried jobs is lower than the advantage in overall salaried jobs. So, reservation has had a bigger equalising effect for SC/ST workers than for OBCs – a possible a reflection of the fact that SC/ST groups get proportionate reservations and OBC do not.
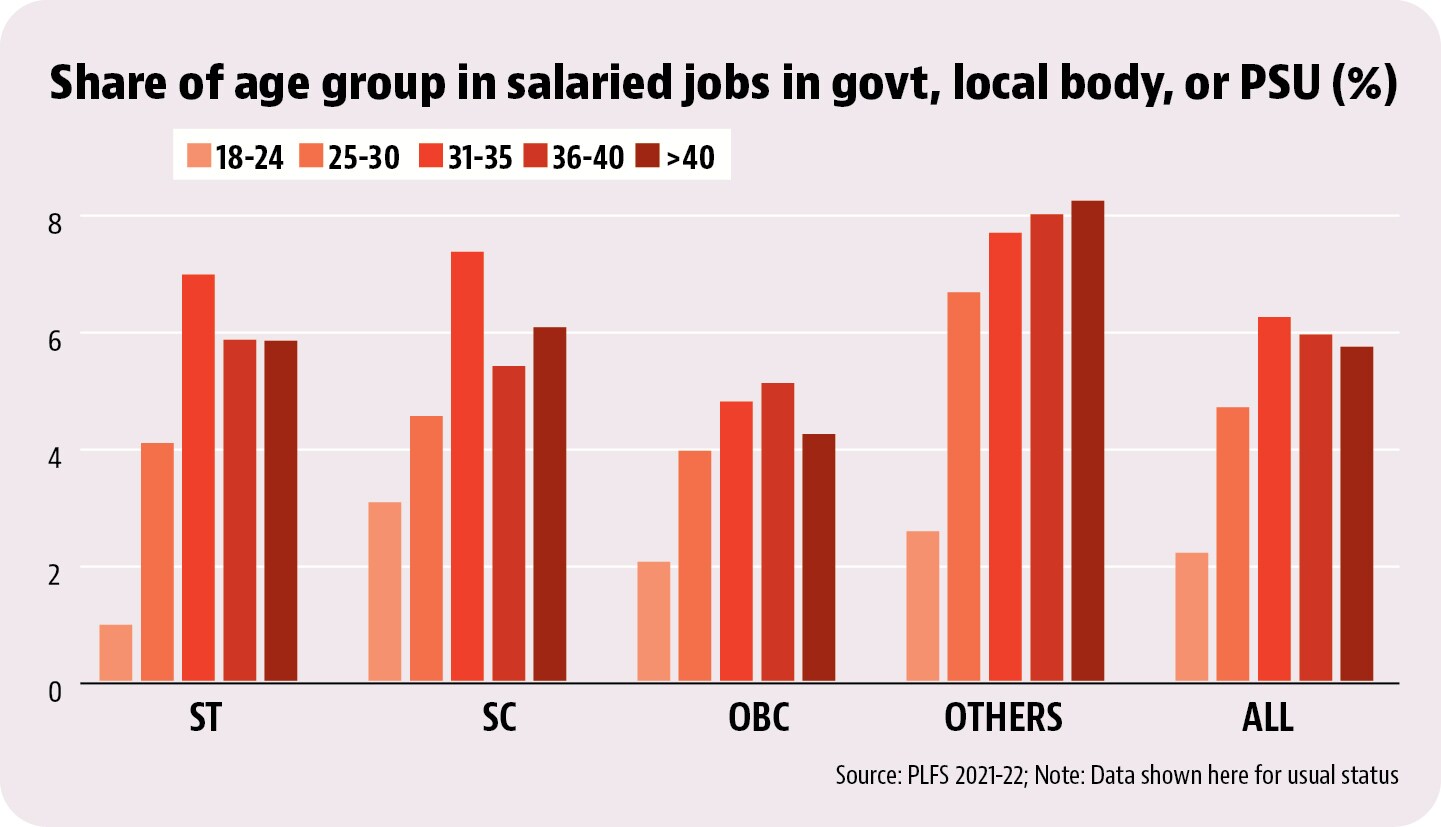
- Share of government job holders is lower among younger workers across social groupsThe data above shows that the demand for proportionate reservations for OBCs could have potential traction given that OBCs have not gained as much from reservations as SC/ST workers have. However, it needs to be kept mind that the share of government salaried job holders has been falling among young workers across all social groups – possibly because the overall pool of government jobs has been losing its importance in the economy. How these factors will play out politically remains to be seen.