


 Live Score
 Teams
Teams Players
Bounciest and quickest pitch outside India in ball-tracking era: Making sense of the Cape Town Test through data
The shortest result match in Test history saw a wicket, on average, falling every 19.4 balls – the lowest dismissal rate in any Test match ever

 Prefer HTon Google


642 balls, 464 runs, 33 wickets.
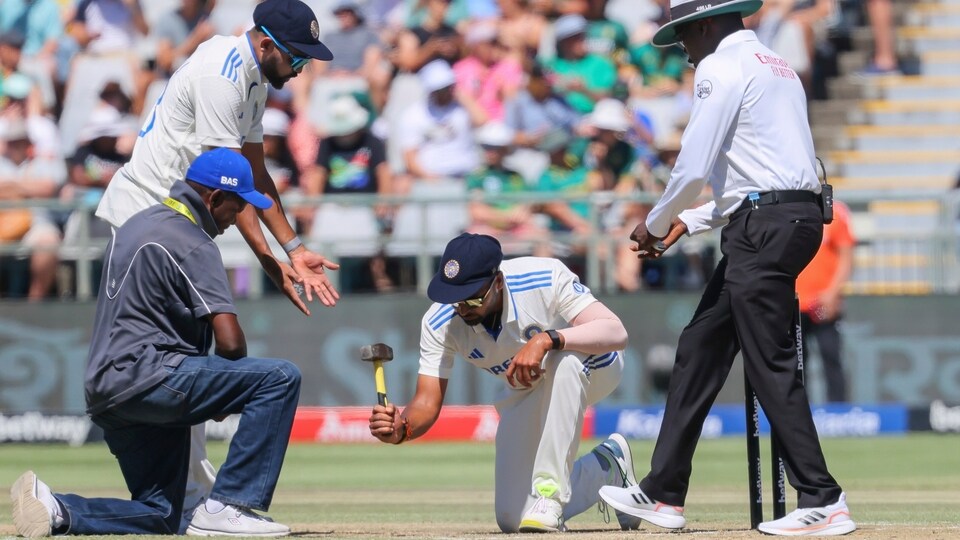
The shortest result match in Test history saw a wicket, on average, falling every 19.4 balls – the lowest dismissal rate in any Test match ever.
While a target of 79 is unlikely to be defended in a Test match, this Test had already had its fair share of ‘first-time-ever’ moments. India’s approach to the chase showed that they were not willing to grind it out, invite pressure and add to this Test’s record book. While it seemed clear that Yashasvi Jaiswal was going to approach it like any other IPL innings, Rohit Sharma attempted to go down the classical route when he went to defend his first delivery of the innings off Kagiso Rabada. Rohit’s attempt at a front-foot block to a good-length delivery left him in considerable pain as it reared and hit his right shoulder. Rohit’s response was to step out and away from the line of the ball to extend his arms. This was the first over of a Test innings against a bowler with 290 Test wickets to his name. Rohit got a couple of runs for his trouble but it characterized what an elite batter with multitudes of international experience thought of this pitch.
HIGHEST PITCHVIZ RATINGS FOR A TEST MATCH
| Match | Runs | Wickets | Average | PitchViz |
| West Indies v England, North Sound, 2019 | 642 | 30 | 21.40 | 9.2 |
| South Africa v India, Johannesburg, 2018 | 805 | 40 | 20.13 | 9.1 |
| South Africa v India, Cape Town, 2024 | 464 | 33 | 14.06 | 9.0 |
| Australia v South Africa, Brisbane, 2022 | 504 | 34 | 14.82 | 8.4 |
| South Africa v Australia, Johannesburg, 2018 | 1172 | 36 | 32.56 | 8.3 |
Note: This doesn’t include India’s home Tests as ball-tracking data is not available for those series’.
As expected, it was central to almost every discussion point around the Cape Town Test, and rightly so.
CricViz’s PitchViz model assesses the characteristics of individual pitches using ball-tracking data and is based on a lot of constituent traits - for example, the pace of the pitch, the consistency in bounce, swing movement, seam deviation, etc., and gives it a rating out of 10. The higher the PitchViz number, the harder it is to bat.
For any Test with a minimum of three innings in it, the 2nd Test at Cape Town emerged as the third-hardest to bat on in the ball-tracking era.
At first glance, you have to feel sorry for the South African batters for having to bat through treacherous conditions repeatedly.
The top entrant here is a Test for which the pitch was deemed ‘below average’ by the ICC. While West Indies managed to win by 10 wickets on the back of their 306 in the 1st innings, England folded for 187 & 132. It was a match that featured a lot of body blows and unplayable deliveries.
Second on the list is another Test between India & South Africa which was under the threat of being called off after a blow to Dean Elgar’s head. It also features another two-day encounter at the Gabba between South Africa and Australia.
If anything, the list illustrates that the pitch at Cape Town for the 2nd Test was as hard as it got to bat on and that it was not just a matter of technical ineptness.
In Tests in Cape Town in the ball-tracking era, the one between South Africa and India saw the second-lowest swing movement for pacers but the highest amount of seam deviation. The match, on average, saw a seam movement of 0.77 degrees – second-most for any Test in South Africa since 2010 (after the South Africa-India Test at Johannesburg in 2018 which saw a seam movement of 0.79 degrees).
It was a perfect pitch for the seam bowlers to utilize - it had prodigious seam movement, trampoline bounce, excellent pace, and enough unevenness to make it all unpredictable.
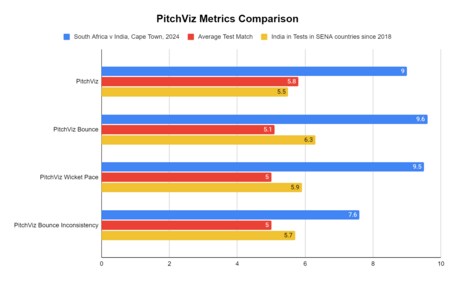
A few of the characteristics the PitchViz model assesses are the “pace” of the pitch, and thus how easy the ball is coming on, it also assesses the “bounce” of the pitch by giving it a rating out of 10 – the higher the number, the quicker and bouncier the pitch. There is also a metric for the consistency of bounce which informs how often a delivery has misbehaved from a similar length. The higher the rating (closer to 10), the more inconsistent the bounce.
According to the PitchViz model, the Bounce rating of 9.6 made this the “bounciest” pitch in the ball-tracking era. It is a similar story with the pace of the pitch as well, a rating of 9.5 makes this the “quickest” pitch ever in the ball-tracking era. The high bounce rating is also compounded by the inconsistency of bounce that was on display – the PitchViz Bounce Inconsistency rating of 7.6 places this ninth on a list of most unpredictable pitches in terms of bounce in the ball-tracking era.
It was also very evident that more deliveries were misbehaving from the Wynberg End as compared to the Kelvin Grove End and the strike bowlers from each team were given that end to take advantage of. It is the end from where Mohammed Siraj picked up his six-wicket haul in the first innings and from where Jasprit Bumrah picked up five of his six wickets in the 2nd innings.
| End | Wickets | Average | Seam Movement (in degrees) | PitchViz Bounce Inconsistency |
| Wynberg End | 21 | 8.4 | 0.87 | 8.0 |
| Kelvin Grove End | 11 | 24.54 | 0.68 | 7.2 |
The Wynberg End not only saw more seam movement in comparison to the other end but also more unpredictability in terms of its bounce.
Despite bowlers ruling the proceedings, it was quite remarkable that the match also contained an individual hundred. According to CricViz’s Expected Runs and Wickets model, Aiden Markram’s 106 off 103 balls in the 2nd innings was the toughest of the 1096 Test Hundreds with ball-tracking available. The Expected Average of the Test at Cape Town was just 17.7 – the lowest for any Test match in the ball-tracking era which not only highlights the treacherous conditions but also the impeccable bowling on display from both teams. It was a Test match truly quite unprecedented in its nature and numbers.


