E-Paper



Number Theory: Three charts which explain the election results
What explains these results? Here are three charts that give an idea.
Published on: Nov 24, 2024, 15:28:55 IST

 Prefer HTon Google
Share via


Copy link

Both Maharashtra and Jharkhand have given a clear verdicts in these elections. The Mahayuti alliance comprising the Bhartiya Janata Party (BJP), Shiv Sena and the Nationalist Congress Party (NCP) has won a thumping four-fifth majority in Maharashtra while the Jharkhand Mukti Morcha (JMM)-led alliance has won a two-thirds majority in Jharkhand. What explains these results? Here are three charts that give an idea.
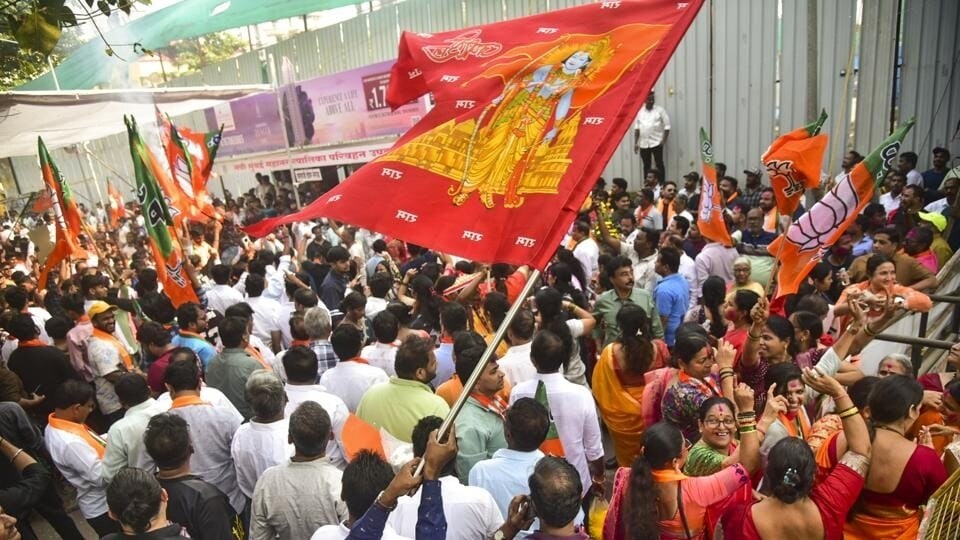
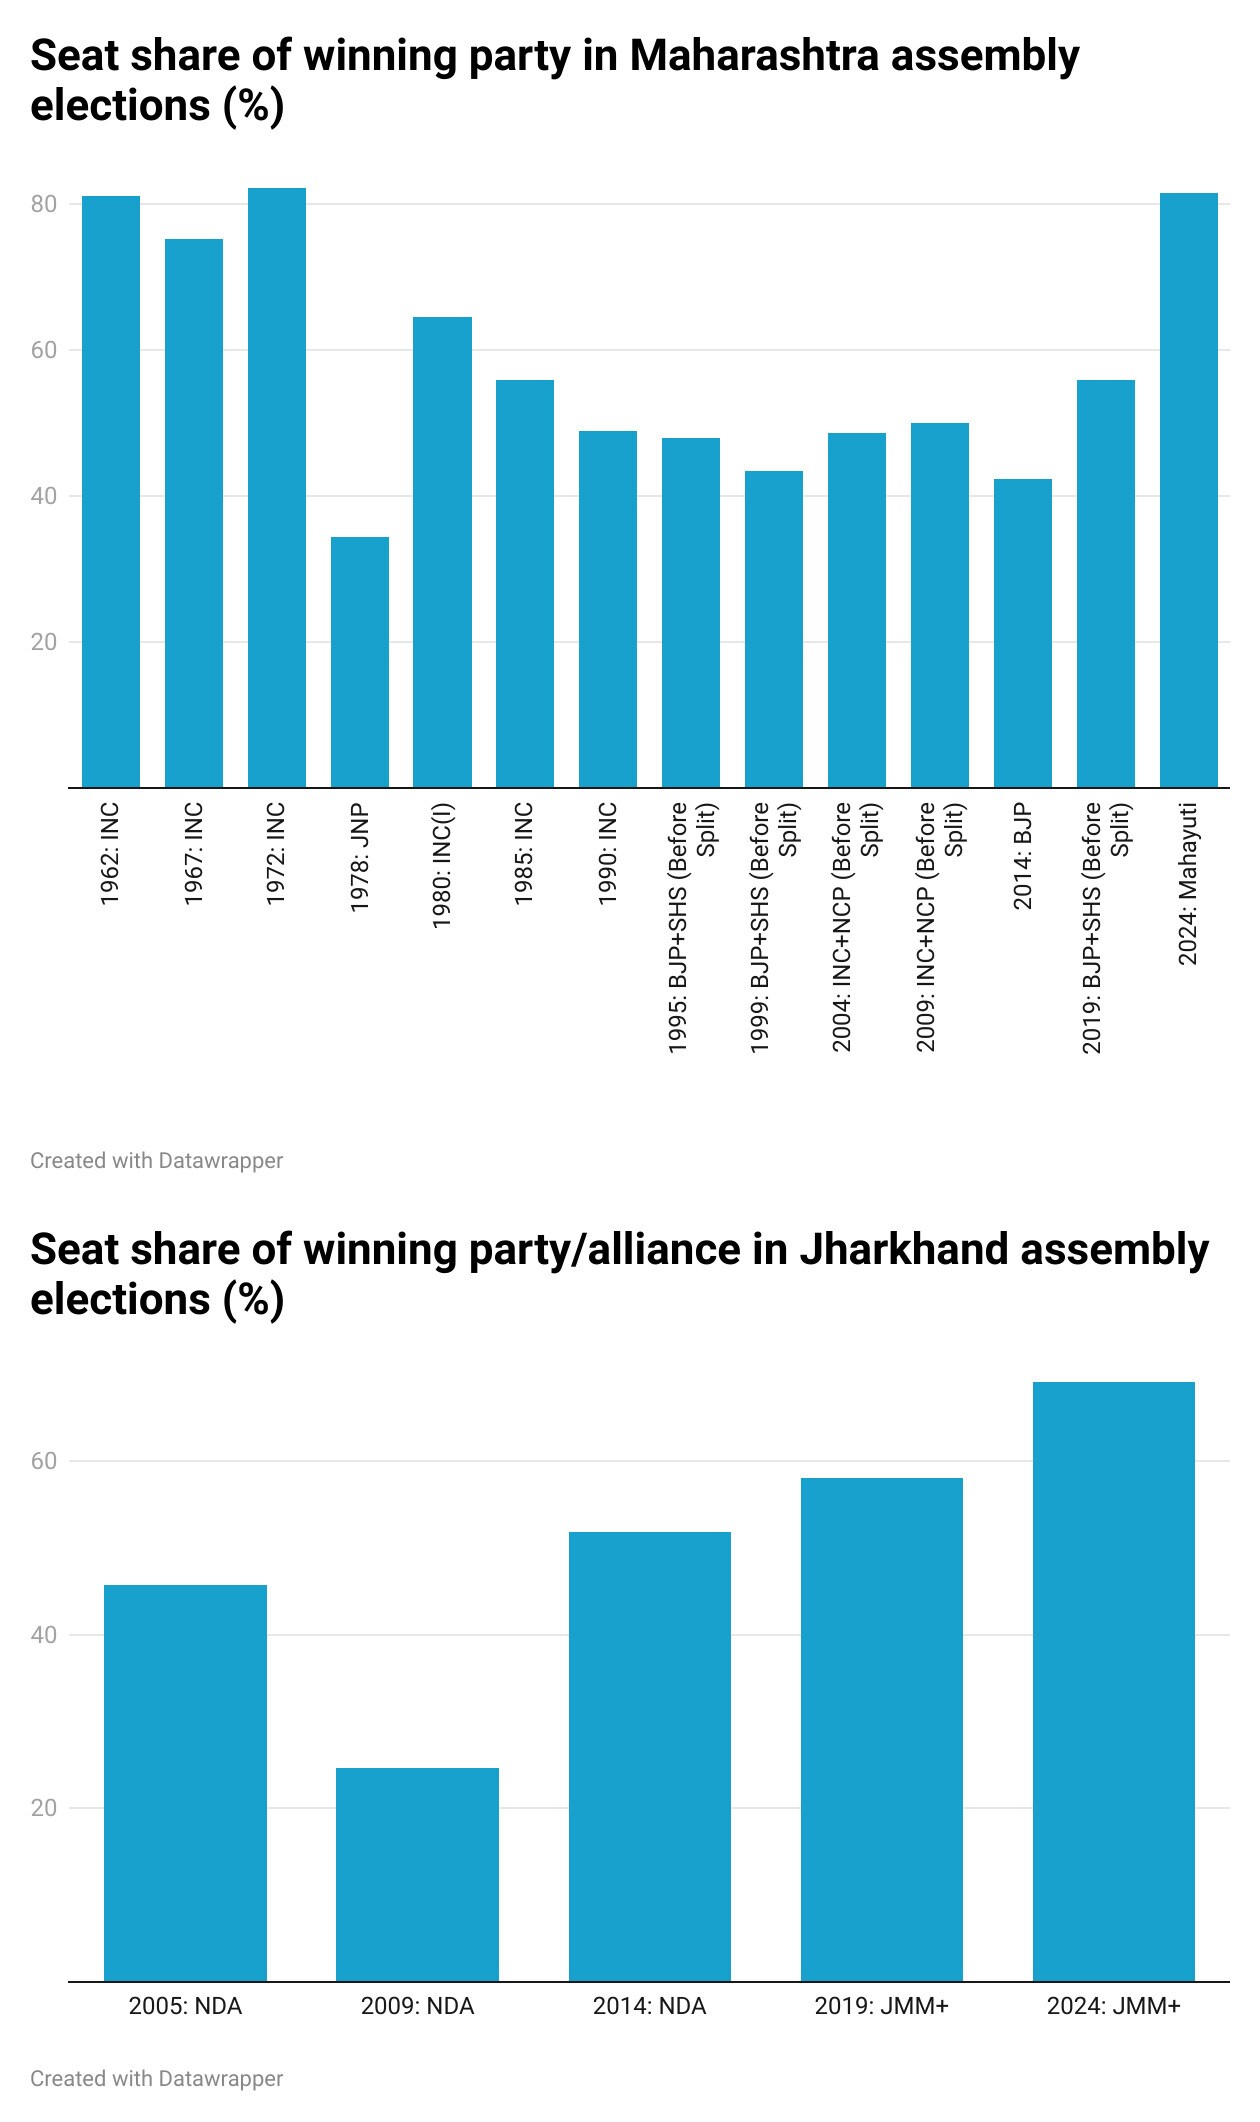
 Pro-incumbency has led to one of the biggest ever victories in these statesVoters have re-elected both the governments . Not only have these governments been re-elected, they have actually increased their majority in the new assembly. In Jharkhand, the JMM-led alliance – it includes the Congress, Rashtriya Janata Dal (RJD) and the Communist Party of India Marxist Leninist Liberation, or CPI (ML) – has won 56 assembly constituencies (ACs) out of the 81. This is the largest ever seat share for a winning party or alliance in the state since its formation in 2000. In Maharashtra, the Mahayuti’s seat share of 81.6% is the largest ever majority for a winning party/alliance in the state since a landslide victory for the Congress in the 1972 assembly elections. In terms of gains compared to its previous tally, the Mahayuti has made a much bigger gain in Maharashtra compared to the JMM-led alliance in Jharkhand. While the former’s seat share has increased by 25.7 percentage points, the latter has added 11.1percentage points to its seat share .
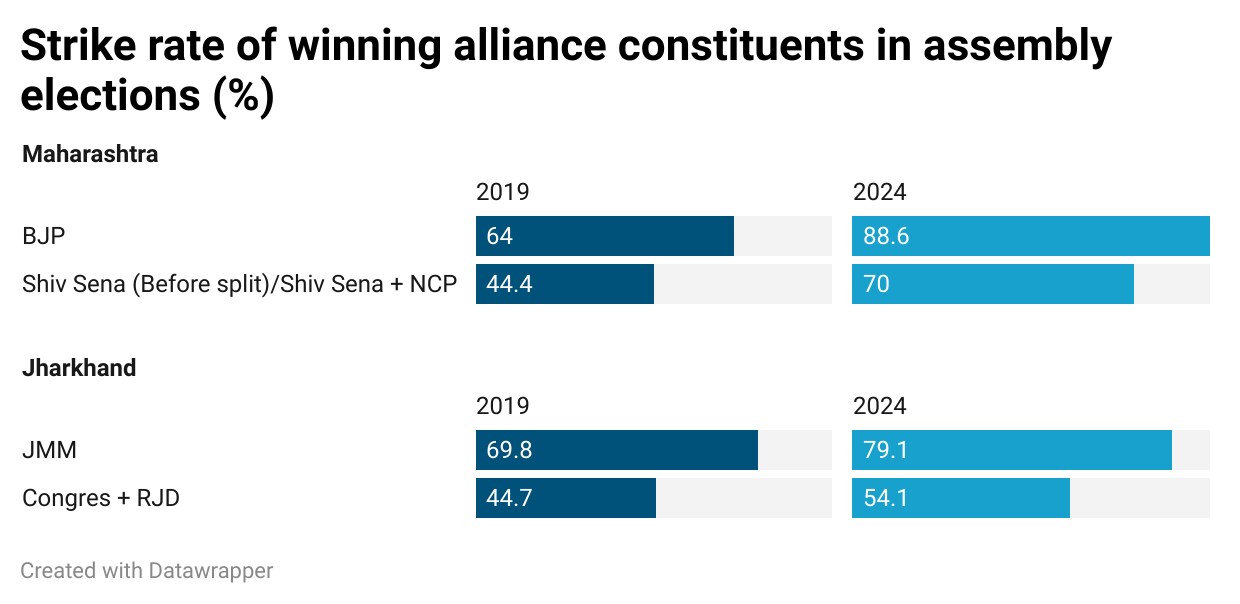
- There is a basic commonality between the performance of alliance partnersThis is another important insight form the electoral data. The performance of all constituents in the winning and losing alliances follow a simple pattern. Their strike rates are above or below the 50% mark depending on which side of the results they are on. This suggests that the electorate voted for the alliance collectively rather than individual parties. To be sure, there is a significant difference in the strike rate of constituents in the wining coalitions in both states with the senior partner doing significantly better than the others. This is also a clear indication of the fact that the alliance’s overall performance has a strong link to the popular support for the leading party. Both in Maharashtra and Jharkhand, the winning parties have increased their seat tally compared to the 2019 elections.
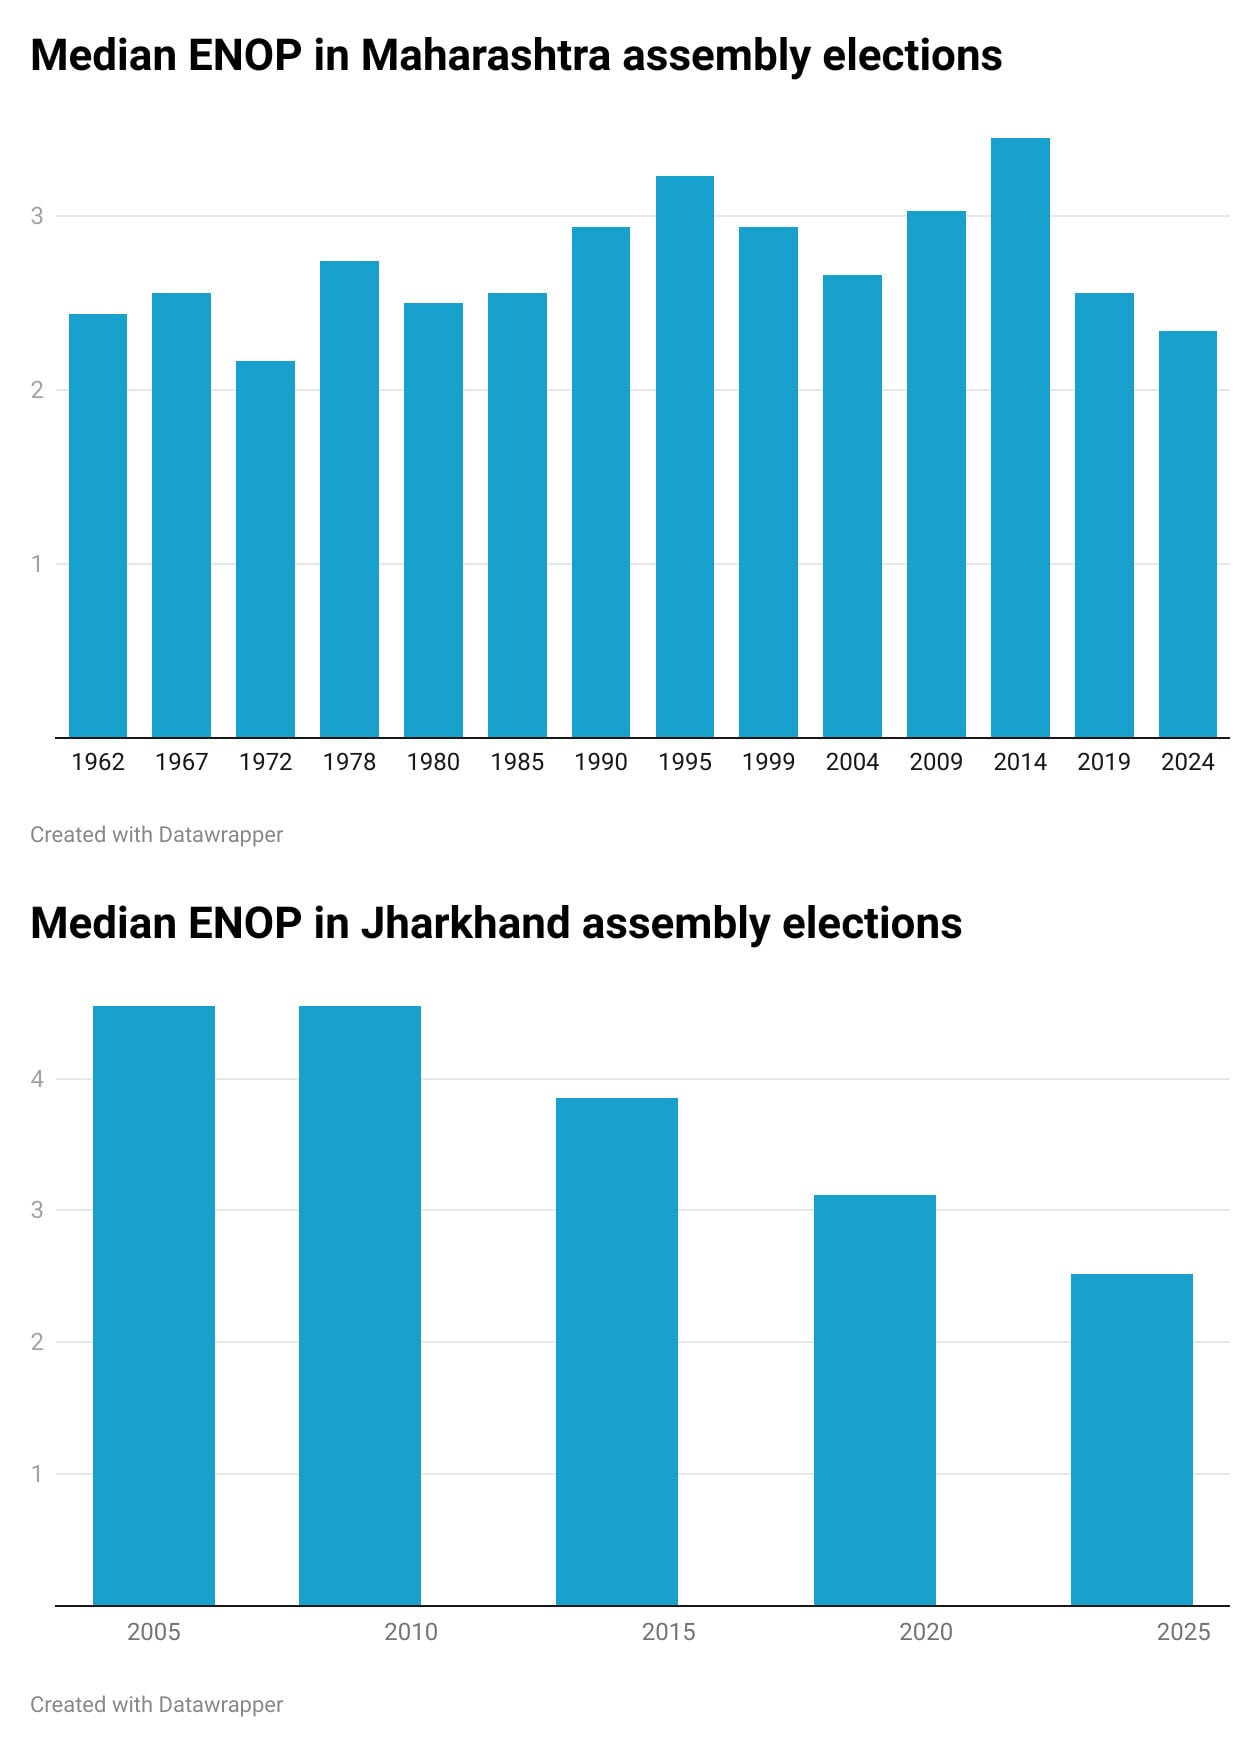
- Both states have seen an increase in the level of political polarisationThis is the most important takeaway from the results. A comparison of median Effective Number of Participant (ENOP) numbers in both Maharashtra and Jharkhand shows this clearly. ENOP is the reciprocal of the sum of the squares of each party’s vote share in an assembly constituency (AC). This number increases if the votes in an AC are fragmented and decreases if the votes in an AC consolidate behind a few parties. For example, if there are just two parties in an AC and they get 80% and 20% of the votes in an AC, the ENOP for the AC will work out to be 1.47. If there are three parties in AC and they get vote shares of 50%, 30%, and 20%, the ENOP for the AC will be 2.63. Therefore, looking at the median value of ENOP across ACs – median shows the middle value in a distribution – shows if the elections were more or less polarised than earlier. In Maharashtra, this number is 2.34 in these elections, the lowest since the 1972 elections, when votes consolidated behind the Congress in a manner similar to the way they have consolidated behind Mahayuti in this election. This is also the case in Jharkhand, where the median ENOP is 2.52, the lowest since the state’s first assembly elections in 2005 .
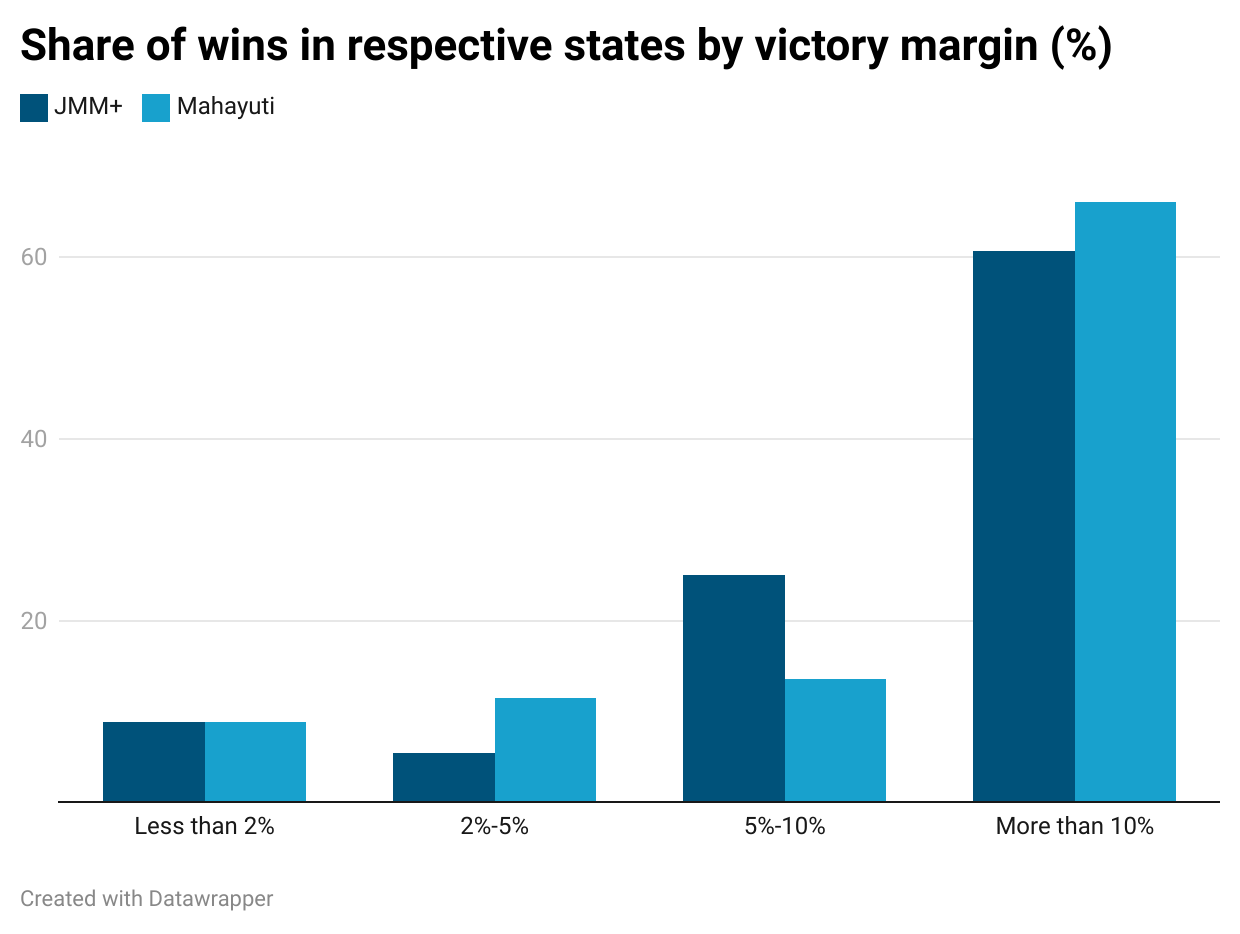
- Polarisation does not mean that these elections were competitiveTo be sure, the polarisation was largely behind the winning alliances. The trend in polarisation described above should not be taken to mean that these were competitive elections. More than half of the wins of the winning alliance in both Maharashtra and Jharkhand came with a victory margin of more than 10%. Less than 10% of wins in Maharashtra and Jharkhand for the winning alliance came with a victory margin of less than 2%.