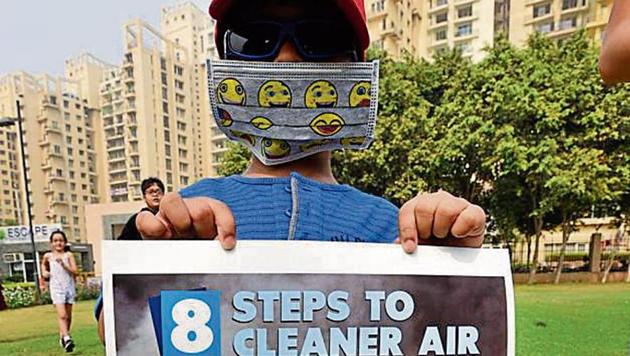
Gurugram residents have been breathing air that has more than double the annual safe limit of PM2.5 for almost two decades, according to a study by The Energy and Resources Institute (TERI) and Indian Institute of Technology, Delhi (IIT-D).
Titled ‘18-year Ambient PM2.5 Exposure and Night Light Trends in India Cities’, the study was published last month in Aerosol and Air Quality Research (AAQR), an international, peerreviewed journal. The study analysed PM2.5 levels in 109 Indian cities between 1998 and 2015.
PM2.5 refers to particulate matter smaller than 2.5 micrometres, which is 100 times thinner than a human hair. The average annual PM2.5 level in Gurugram was found to be 85.8ug/m3 (micrograms per cubic metre of air). The safe limit, as per the Central Pollution Control Board’s (CPCB) National Ambient Air Quality Standards, is 40ug/m3.
“PM2.5 consists of ammonia, sulphates, nitrates and other pollutants. These can enter the lungs through ambient exposure and aggravate respiratory and cardiovascular problems,” said Dipankar Saha, former Additional Director of CPCB’S Air Quality Lab.
Mukesh Khare, professor of environmental engineering at IIT-D, said, “85.8 might not sound like a huge number when compared to PM2.5 levels that we see in winter, which can be as high as 200µg/m3 per day. But as an average measure over 18 years, the number is alarming.”
{{/usCountry}}Mukesh Khare, professor of environmental engineering at IIT-D, said, “85.8 might not sound like a huge number when compared to PM2.5 levels that we see in winter, which can be as high as 200µg/m3 per day. But as an average measure over 18 years, the number is alarming.”
{{/usCountry}}The study also found that the average annual PM2.5 level in Gurugram has increased by 21ug/m3 since 1998.
The average rate of increase for all 109 cities was found to be 1.15µg/m3 per year, suggesting that Gurugram is accumulating these pollutants at a faster rate than other metropolises.
The situation may be worse now. According to data obtained from CPCB’S website, the average annual PM2.5 level in Gurugram from June 4, 2017 to June 4, 2018 is 139.83µg/m3. “Gurugram is part of a larger geographic dust bowl,” said Saha. “About 25% of PM2.5 in the region is naturally occurring. There is little rainfall due to which the topsoil is loose. Real estate activities in Gurugram have disrupted traditional land use patterns and disturbed the soil, letting more inert particles into the atmosphere. Real estate has brought in more people, more waste and more vehicles. Now, this human activity makes up the remaining, harmful 75% of PM2.5, which is caused by exhaust fumes, open fires, livestock emissions and other things.”
Piyush Goel, a pulmonologist at Gurugram’s Columbia Asia Hospital, said, “Many patients, especially those above 60, are now showing decreased lung function. Particulate matter in the air is a major cause for this. We also find that even 35 and 40 year olds are now suffering from heart attacks, which was not observed earlier. I see more cases of asthma and chronic obstructive pulmonary disorder also these days.”
Taking into account existing health-care facilities and mortality rates, the AAQR study also ranks cities on a vulnerability scale of 1 to 6, depending on how at risk its population is.
Gurugram was ranked at number 4 (‘very high’) on the vulnerability scale. Delhi was ranked at number 5 (‘severe’), while cities with less developed health-care infrastructure, such as Lucknow, Kanpur and Agra, have been classified at number 6 (‘extremely vulnerable’).
Khare suggested that the central and state pollution control boards actively clamp down on activities emitting PM2.5. “In Gurgaon, these would be construction, open burning of waste and vehicles,” he said.
The CPCB in 2017 issued a Graded Action Plan (GRAP) to curb the problem of air pollution, followed by a Comprehensive Action Plan (CAP) in January 2018. Saha said many state pollution control boards have been slow to implement these.
Stay updated with all the Breaking News and Latest News from Mumbai. Click here for comprehensive coverage of top Cities including Bengaluru, Delhi, Hyderabad, and more across India along with Stay informed on the latest happenings in World News.
Stay updated with all the Breaking News and Latest News from Mumbai. Click here for comprehensive coverage of top Cities including Bengaluru, Delhi, Hyderabad, and more across India along with Stay informed on the latest happenings in World News.