On Diwali night, the government air monitor at Nehru Nagar in Delhi recorded 812 micrograms of PM2.5, the fine particles that lodge deep in the lungs, in a cubic metre of air between 9pm and 10pm. The Central Pollution Control Board (CPCB) published an air quality index (AQI) of 387 for the station at 10pm. The formula that the US government uses turns 812 into 1,469, and the UK’s index gives it 10, the top of its scale.
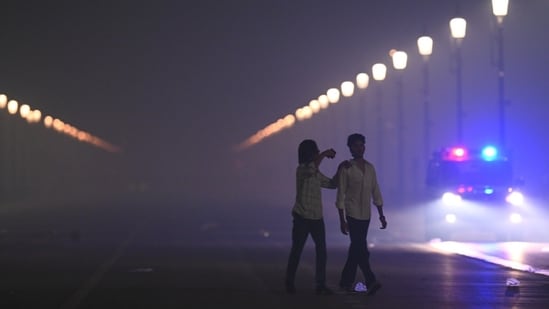
Through the night, screenshots from apps and home monitors showing Delhi’s air quality readings at 1,000+ and 2,000+ spread on social media while the official figures stayed in the 400s. Many of these came from apps using a different scale and shorter averaging periods.
What is an AQI?
A monitor measures how much of a pollutant is in the air, in micrograms per cubic metre (µg/m³). An AQI converts that measurement into a score, using bands that a government sets. Governments decide where each band begins, how long a period the readings are averaged over, and where the scale ends. So two indices can give very different scores for the air at one place at one time.
Why does India’s index stop at 500?
India’s National Air Quality Index was announced in April 2015. An expert group of doctors, air quality specialists, academics and state pollution boards drew it up for CPCB, with technical work by IIT Kanpur. It has six bands: good (0 to 50), satisfactory (51 to 100), moderate (101 to 200), poor (201 to 300), very poor (301 to 400) and severe (401 to 500).
{{/usCountry}}India’s National Air Quality Index was announced in April 2015. An expert group of doctors, air quality specialists, academics and state pollution boards drew it up for CPCB, with technical work by IIT Kanpur. It has six bands: good (0 to 50), satisfactory (51 to 100), moderate (101 to 200), poor (201 to 300), very poor (301 to 400) and severe (401 to 500).
{{/usCountry}}For PM2.5 averaged over 24 hours, “good” covers up to 30 µg/m³, half of India’s national standard of 60 µg/m³, and “satisfactory” goes up to this threshold.
The committee drew the next line at 90 µg/m³, the level at which a global study of disease found the added risk of heart disease levels off, and for the bands above that, the report says, adopted the cut-offs proposed in the US and China.
For the severe band, it advised that the air “may cause respiratory effects even on healthy people”.
The severe band for PM2.5 is written in CPCB’s report as “250+”. The report does not give a concentration for an index of 500 and does not say anything about values above it. CPCB’s published figures stop at 500. In CPCB’s calculation, the PM2.5 sub-index reaches 500 at 380 µg/m³ and does not go higher, HT reported in 2024.
“Beyond 500, the values are not recorded, which means that if a station is showing an AQI of 500, the values could be anywhere above 500. It could be even 900, we wouldn’t know,” a senior CPCB official had told HT in November 2019, when at least four of Delhi’s 38 stations reached 500 and CPCB data showed PM2.5 at between 620 and 690 µg/m³ at stations in Bawana and Anand Vihar.
Part of the reasoning for the cap, according to officials, is that the index is meant to warn people about the health risk and set off pollution curbs. The index, according to CPCB, was “a tool for effective communication of air quality status to people”. The official who spoke to HT in 2019 added, “What matters is the PM (particulate matter) concentration, based on which measures are taken to curb pollution.”
On Diwali night last year, about 93% of hourly PM2.5 readings at Delhi’s stations between 10pm and 6am were above 250 µg/m³, where CPCB’s severe band begins, HT’s analysis of data showed.
Also read: Delhi records 3rd worst Diwali pollution since '21, data gaps cloud full picture
Why did Nehru Nagar show only 387?
CPCB also works out each station’s index from its average over the previous 24 hours, so a spike at night may be diluted by the cleaner hours of the afternoon before. At 10pm on Sunday, Diwali night, Nehru Nagar’s average still included those afternoon hours. The station stopped reporting after that hour, and CPCB likely kept calculating its index from the readings it had.
To compare the worst hours across the years, HT’s analysis of Diwali night extended CPCB’s PM2.5 sub-index calculation beyond its last band. On that measure, the worst hour this year averaged 655 across six long-running stations, against 812 in 2021 and 752 in 2025.
How do the UK and US scales work?
The UK’s Daily Air Quality Index runs from 1 to 10, grouped as low, moderate, high and very high. It gives 10 to any 24-hour average of PM2.5 at 71 µg/m³ or more. Nehru Nagar’s Diwali reading was more than 11 times that level.
The US Environmental Protection Agency’s (EPA) index also uses six bands, from good to hazardous. The agency tightened it from May 6, 2024: “good” now ends at 9 µg/m³ of PM2.5, down from 12, and “hazardous” begins at 225.5 µg/m³, down from 250.5. An index of 500 now corresponds to 325.4 µg/m³.
The US index does not stop at 500. “All AQI values above 300 are part of the Hazardous category. This includes values above 500,” the EPA says in its technical guidance to the agencies that report the index, and it tells them to calculate those values along the line that runs from 301 to 500. On that line, each additional µg/m³ adds about two points to the index. Under the scale used before 2024, each added about two-thirds of a point.
So, Nehru Nagar’s 812 would score 1,469 on the current scale and 706 on the old one.
Like India’s, the US index is meant to be read over a day. “It takes a full 24 hours to obtain an AQI value,” the EPA says.
Where do the four-digit numbers come from?
Most apps that showed Delhi in the thousands on Diwali night use the US scale, and many apply it to readings taken over an hour or less.
IQAir labels its figure “U.S. AQI⁺” and says it is based on hourly averages. Its Delhi page lists CPCB and the Delhi Pollution Control Committee among 19 contributors of data, alongside embassies, schools and individuals, so some of its Delhi figures start as government readings.
The World Air Quality Index Project, which runs aqicn.org, uses the US formula on the latest station readings and says its data are “unvalidated at the time of publication”.
PurpleAir’s map shows the US index calculated from the raw readings of its laser particle counters. AQI.in, run by Delhi-based Purelogic Labs, labels its figure “AQI (US)”, draws on what it calls “community monitors”, and uses its own band names, in which “severe” covers 201 to 300. Google’s air quality service shows India’s own index for Indian locations by default.
The government’s own hourly Diwali readings, put through the US formula, give four-digit numbers. Pusa’s 881 µg/m³ on Diwali night scores 1,607, and Delhi’s worst hour on Diwali last year, when stations averaged 1,137 µg/m³, scores 2,117.
The EPA advises against producing an index from such short readings. “It is not valid to use shorter-term (e.g., hourly) data to calculate an AQI value,” its guidance says, and the agency “does not advise applying AQI values to realtime sensor data, especially 1-minute readings.”
Also read: Restrictions flouted, ‘green’ firecrackers bring little respite from Delhi’s Diwali pollution
Can home monitors be trusted?
Low-cost monitors, including PurpleAir’s, shine a laser through the air and measure the light that particles scatter. In humid air, particles take up water and swell, scatter more light, and the sensor reports more particulate matter than is there. Researchers who ran PurpleAir sensors beside a reference monitor at the US embassy in New Delhi between 2018 and 2020 found that the uncorrected sensors overestimated PM2.5 in the humid post-monsoon and winter months. When corrected for humidity, season by season, they came within about 25% of the reference instrument, the team reported in Atmospheric Measurement Techniques in 2023.
An earlier study by researchers from Duke University and IIT Kanpur, published in 2018, found that the readings of a common sensor of this type stopped rising in step with actual concentrations once PM2.5 went above about 125 µg/m³.
IQAir and AQI.in do not say on their websites how they correct readings from low-cost sensors, and PurpleAir allows its users to decide whether to apply a correction.
A sensor also measures only the air around it, so one placed on a balcony above a lane full of firecrackers only records that lane.
How should readers compare the numbers?
Most apps show the concentration in µg/m³ beside the index, so concentrations of specific pollutants can be compared directly across sources and countries.
The World Health Organization advises that 24-hour exposure to PM2.5 should not exceed 15 µg/m³.
But, before comparing two numbers, check which scale each uses and how long a period it covers. Following one source over several days shows more clearly whether the air is improving than setting two sources side by side.