
 E-Paper



An hour-by-hour account of how Delhi’s air quality tanked on Diwali
Delhi air was cleaner on Diwali eve in 2021 than it was in 2019 and 2020. Things went downhill rapidly.

 Prefer HTon Google


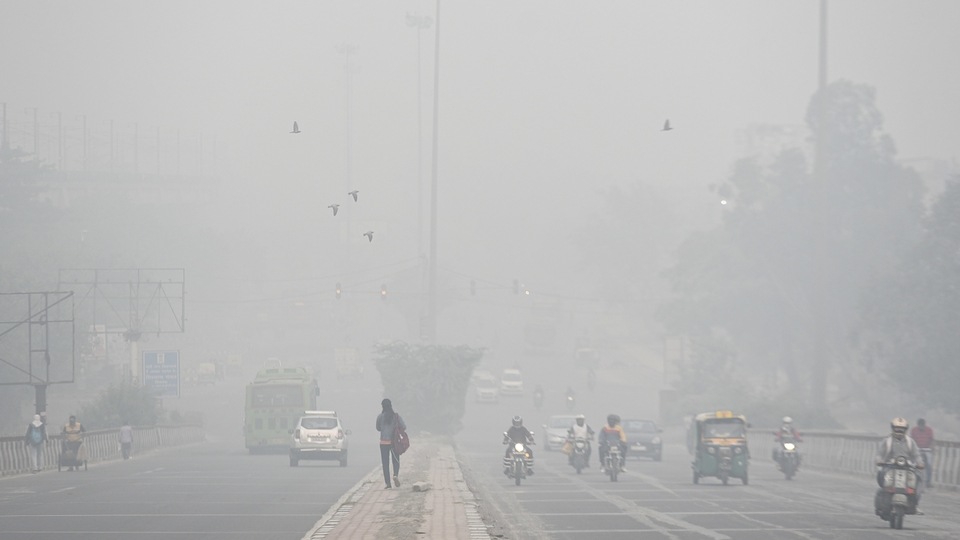
Delhi woke up to one of its most polluted mornings this year after Diwali, according to Air Quality Index (AQI) data, with farm fires in Punjab and Haryana, and the use of fireworks on Diwali night (Thursday) contributing to the spike.
To be sure, AQI is not the best metric for comparison if data for all pollutants is not available. This is because AQI is simply the highest among the sub-indices for different pollutants. If the data for one or more significant pollutants is not available, we might just be looking at the highest sub-index among available data. Still, on the basis of available data, two things are clear: this was among the most polluted Diwalis in Delhi and fireworks are not the only cause for the spike in pollution.
HT analysed hourly PM 2.5 concentration levels and wind speed and the number of farm fires per day from three days before Diwali for 2019 (October 27), 2020 (November 14) and 2021 (November 4) to reach this conclusion. The analysis is based on data from five monitoring stations – Aya Nagar station of the India Meteorological Department, and the Najafgarh, Narela, Punjabi Bagh, and Sri Aurobindo Marg stations of the Delhi Pollution Control Committee – which have hourly data for all three years.
Delhi air was cleaner on Diwali eve in 2021 than it was in 2019 and 2020. Things went downhill rapidly. At midnight on Diwali, the average PM 2.5 level in Delhi was 613.2 micrograms per cubic meter, higher than what it was at Diwali midnight in 2019 and 2020. However, what is more remarkable is the fact that pollution levels kept rising even after midnight. One would assume that cracker bursting reduced if not completely ended by this time. Average PM 2.5 level reached 729.6 micrograms per cubic meter between 3 am and 4 am hour on November 5, much higher than what it was during Diwali in 2019 and 2020.
Low wind speed did not help
So, is it just crackers that are to blame? Data does not support such a claim. Take wind speed for instance. Pollution levels fall with a rise in wind speed. This year there was hardly any wind to carry the pollutants away. This was especially true during the evening when crackers would have had the maximum impact on pollution.
More farm fires this year
Pollution levels started rising even before Diwali in Delhi. The biggest reason for this has been an increase in number of farm fires in neighbouring states. Not only has the number of farm fires increased significantly during the past few days, this number is significantly higher for this Diwali than in 2019 and 2020. Data from System of Air Quality and Weather Forecasting And Research (SAFAR) shows that farm fires contributed 25% of PM2.5 in Delhi’s air on Diwali (November 4). This is the biggest contribution on any day this year since October 20.



