E-Paper



Understanding the history of Delhi's flooding pattern
A look at how the pattern of floods in Delhi has changed over the past few decades
Published on: Jul 14, 2023, 11:20:24 IST

 Prefer HTon Google
Share via


Copy link

The Yamuna’s water level at the Old Railway Bridge in the Capital was 208.63 m at 10pm on July 13, according to Central Water Commission (CWC) data from a real-time hydrograph at the location. This is only somewhat lower than the all-time high of 208.66 metres that the hydrograph recorded in hourly readings from 6pm to 8pm on July 13. While the real-time forecasts of the CWC as of 10pm suggest that the water level in the Yamuna will decrease to 208.45 metres by 3pm on July 14, this is still above the official danger level of 205.33 metres.
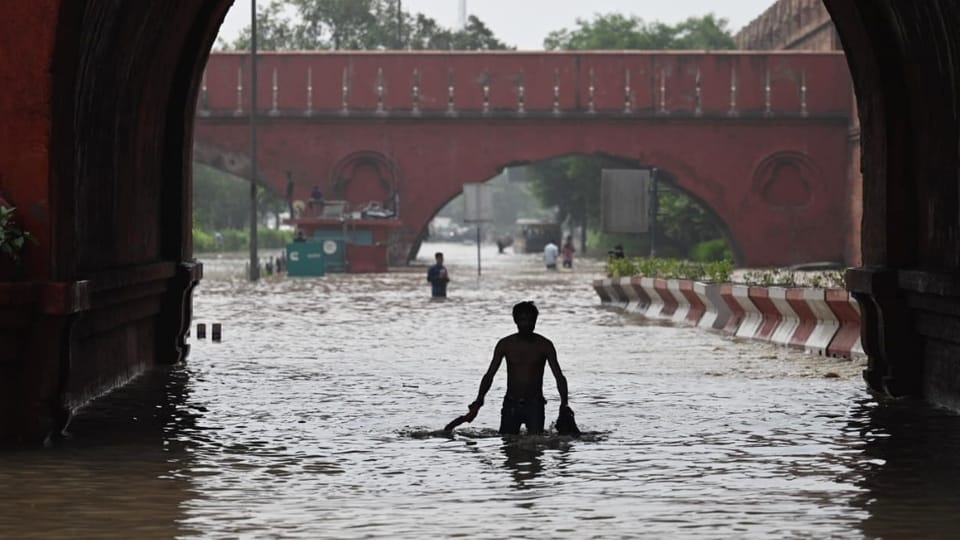
Parts of Delhi were flooded on Thursday as Delhi saw its first floods since 1978. But the flooding pattern of the city has changed. Here are four charts that show that.
The charts that matter
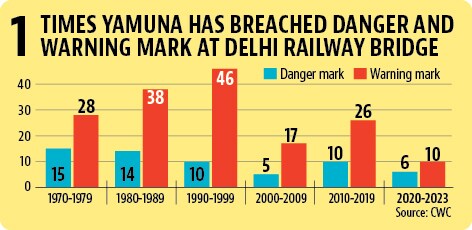
 Yamuna has reached danger and warning levels fewer times in recent decadesThe danger level of Yamuna – the level at which floods are likely – is 205.33 metres, according to CWC, and the warning level is 204.5 metres. The number of times when Yamuna has breached these thresholds has decreased somewhat over time. For example, 15 of 60 such events took place in the 1970-79 decade itself. There were only 10 such events in the 2010-2019 decade. To be sure, the river has reached this level six times already during the 2020-23 period.
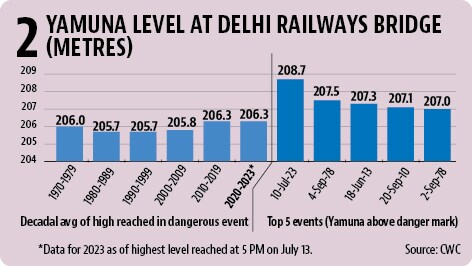
- But it reaches higher levels now when it crosses the danger thresholdThat Yamuna reaches danger levels fewer times now means that it has less chance of flooding Delhi now. This is no guarantee of the impact when it does overflow. HT averaged the highest level each dangerous event reached for every decade. This shows that the average highest level reached in a dangerous event in 2020-23 (including the current flood) is 56 centimetres (or around half a metre) more than in 1980-89, the period from when this number has consistently increased. To be sure, it is possible that the average for the 1970-1979 decade was somewhat higher than appears in this analysis. This is because the granular data maintained by CWC online records the highest level reached in 1978 (the highest level before 2023) as only 207 metres and not 207.49 metres as reported by CWC in summary reports. Despite this, the 2023 level is now 117 centimetres above the second highest value, reached in 1978 and 134 centimetres above the third highest value reached in June 2013.
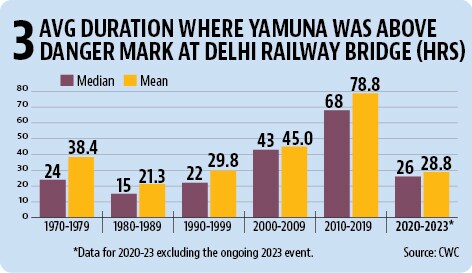
- The duration for which Yamuna remains above the danger level is also longer nowThis can be expected from the fact that the Yamuna now reaches higher levels when it crosses the danger mark. The average duration of Yamuna breaching the danger mark had increased from 21.3 hours in 1980-89 to 78.8 hours in the 2010-2019 decade. This broad trend of increasing duration holds true even if one is looking at the median (the middle value) duration of such events in every decade. To be sure, the average duration during 2020-23 was only 28.8 hours before the 2023 event. This is likely to change as the current event (which started at 4 PM on July 10) will reach the 100 hour mark at 8 PM on July 14, a likely scenario according to CWC’s forecast. The longest duration for which Yamuna has remained at or above the danger mark was for 167 hours in 2010: from 3 PM on September 10, 2010 to 2 PM on September 17, 2010. There are six times Yamuna has persisted at the danger mark for 100 hours or longer. Three of them were in August and September 2010. The other three such 100-hour or longer events took place in August 1971, September 1995, and August 2008.
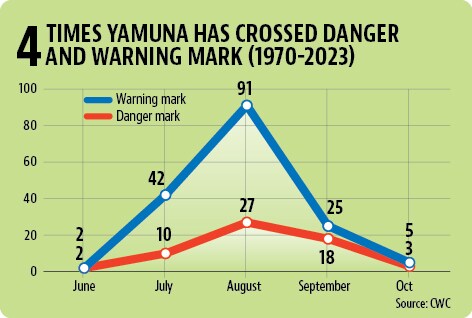
- Historical trends suggest that Delhi must make a permanent plan for monsoon monthsWhile the above trends might seem alarming, they are not completely unpredictable. Of the 60 times Yamuna has crossed the danger mark in Delhi, and the 165 times it has crossed the warning mark, almost half have been in August. July and September are the other two months when such events have a high frequency. The Yamuna has never crossed the warning or danger level outside the June-October period, which roughly coincides with the official June-September monsoon season. Clearly, authorities should have a permanent plan for handling sudden flooding during monsoon. To be sure, as HT reported during the 2019 floods, the Yamuna flooding in Delhi is not necessarily because of rains becoming more intense in Delhi. It is more likely that the Yamuna floods in Delhi now because of heavy rains in the states upstream. Therefore, any plans to manage Yamuna floods in Delhi will have to involve all states through which Yamuna passes before reaching Delhi.