Emissions from industries, transport and homes accounted for more than 80% of particulate pollution for PM2.5 – small pollutant particles that are most harmful and can easily enter the lungs and cause respiratory and cardiovascular illnesses – in the Mumbai Metropolitan Region (MMR) in 2016, revealed a study by the System of Air Quality Weather Forecasting and Research (SAFAR).
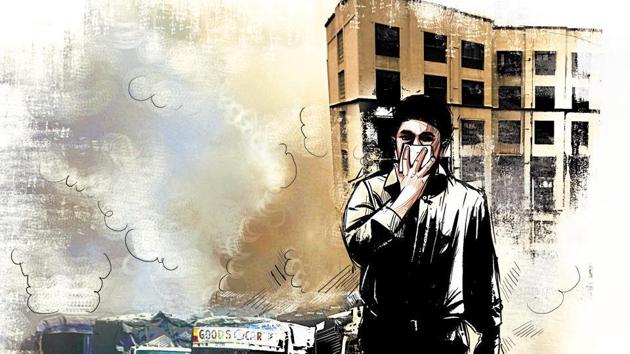
The study identified the sources for three pollutants – particulate matter PM2.5, PM10 , and oxides of nitrogen (NOx). The data has been released for the first time since National Environmental Engineering Research Institute (NEERI) carried out a similar study in 2009.
“We had conducted a similar study in 2014, but it was not made public. However, the result of this study shows a similar trend with less than a 5% increase in sources. Based on steps taken by the state and central government in 2017, the data might change during our next analysis,” said Gufran Beig, project director, SAFAR. “The current data can be used by state authorities to regularise emission sources from each sector.”
For PM2.5, the percentage share from industries in 2016 was 26.43% and power sector was 9.39%, more than a third of all sources. “These two sources need to be combined and seen as the largest source of PM2.5 pollution in the MMR,” said Beig. “These industries are mostly thermal- and coal-based units located in Navi Mumbai, Thane, Dombivli, Kalyan and surrounding areas of Mumbai.”
The next major source for PM2.5 was identified from the residential sector at 27.05%. “Slum areas in the city, responsible for biofuel burning, which includes fuels such as kerosene, wood burning, using cow dung for mostly cooking purposes and biomass burning, was a major source for poor to very poor air quality during 2016,” said Beig.
{{/usCountry}}The next major source for PM2.5 was identified from the residential sector at 27.05%. “Slum areas in the city, responsible for biofuel burning, which includes fuels such as kerosene, wood burning, using cow dung for mostly cooking purposes and biomass burning, was a major source for poor to very poor air quality during 2016,” said Beig.
{{/usCountry}}The remaining sources for PM2.5 included 21.2% from windblown suspended dust that gets trapped close to the earth, mostly coming from construction activities, paved, unpaved roads and ready mix concrete plants. The remaining 15.93% was generated from the transport sector with vehicular emissions as the primary source.
Stay updated with all the Breaking News and Latest News from Mumbai. Click here for comprehensive coverage of top Cities including Bengaluru, Delhi, Hyderabad, and more across India along with Stay informed on the latest happenings in World News.
Stay updated with all the Breaking News and Latest News from Mumbai. Click here for comprehensive coverage of top Cities including Bengaluru, Delhi, Hyderabad, and more across India along with Stay informed on the latest happenings in World News.