E-Paper



Number Theory: Caste matrix of India’s council of ministers
This is the second of a four-part series based on HT’s caste database of council of ministers in India. The first part introduced the database and methodology.
Updated on: Aug 23, 2024, 16:25:18 IST

 Prefer HTon Google
Share via


Copy link

The first part of this series explained in detail the methodology behind the council of ministers dataset between 1952 and 2024, and the growing size of India’s council of ministers. The second part looks at the caste matrix in this dataset. The third and fourth parts will look at state-wise trends in council of ministers and party-wise break-up of council of ministers.
Caste matrix of India’s council of ministers
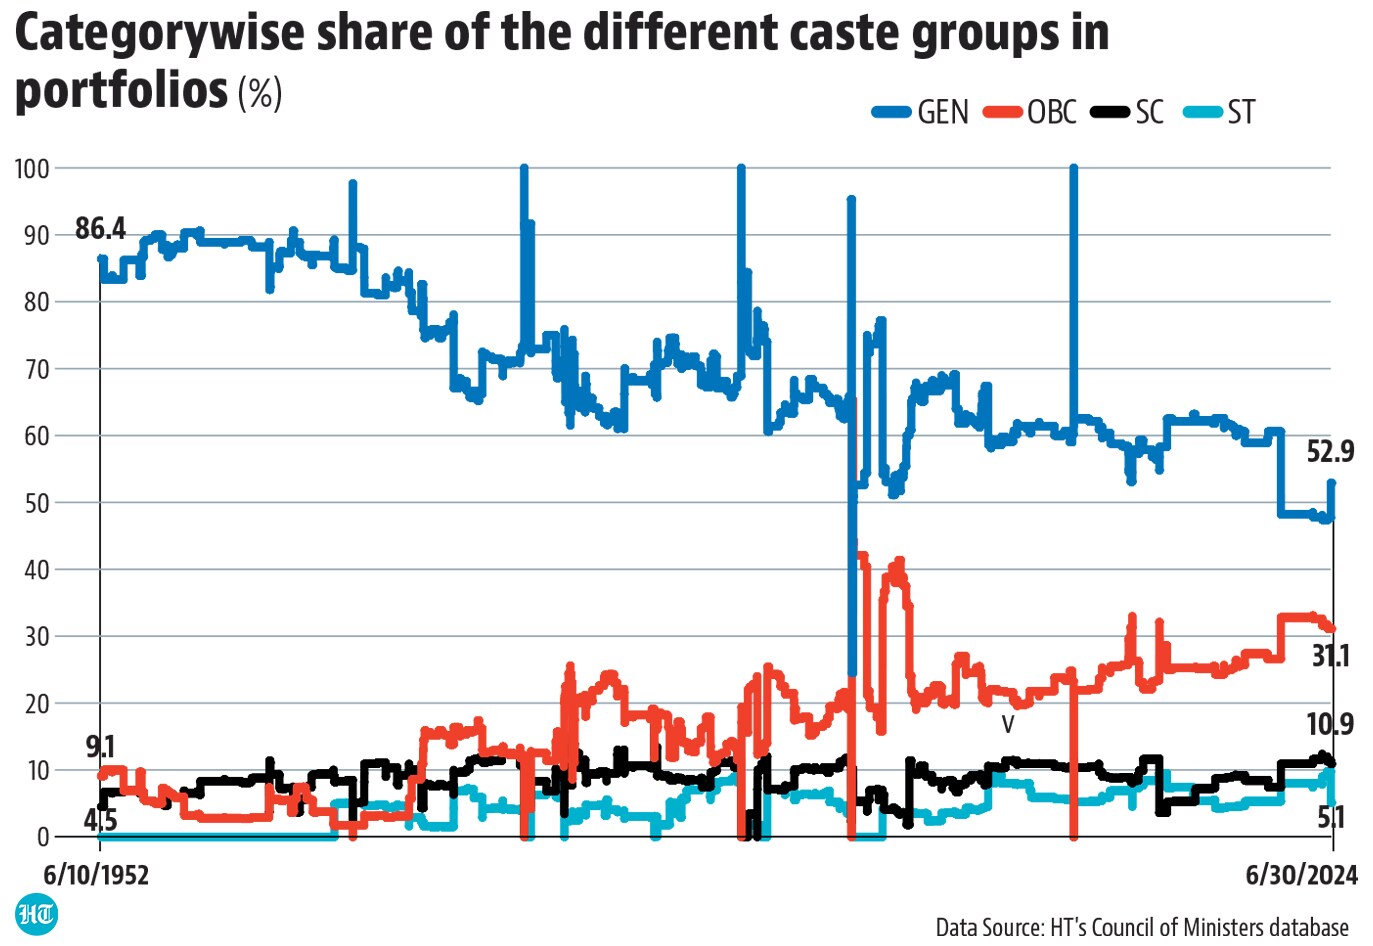
 Caste inequality in the council of ministers has been shrinkingA long-term analysis of social group-wise shares in the council of ministers shows this clearly. The share of non-SC/ST/OBC ministers in the council of ministers was more than 90% in the 1950s. It has come down to about 50% in the latest Cabinet. To be sure, even now these groups continue to have a much larger share than their overall population. The biggest beneficiaries of the falling dominance of non-SC/ST/OBC groups in the council of ministers have been the OBCs. The share of SC/ST groups in the council of ministers has been largely constant in the last five decades. This trend is in keeping with the one seen in the caste database of chief ministers published in these pages in August 2023. A comparison of the social composition of all 25 council of ministers from 1952 shows that only once did the share of non-SC/ST/OBC groups lag behind other caste groups. The share of OBCs was the highest for HD Deve Gowda’s council of ministers that took an oath of office in 1996. To be sure, the fall in caste inequality in the council of ministers has been accompanied by a rise in religion-based inequality. The current council of ministers, for instance, is the first which does not have any Muslim.
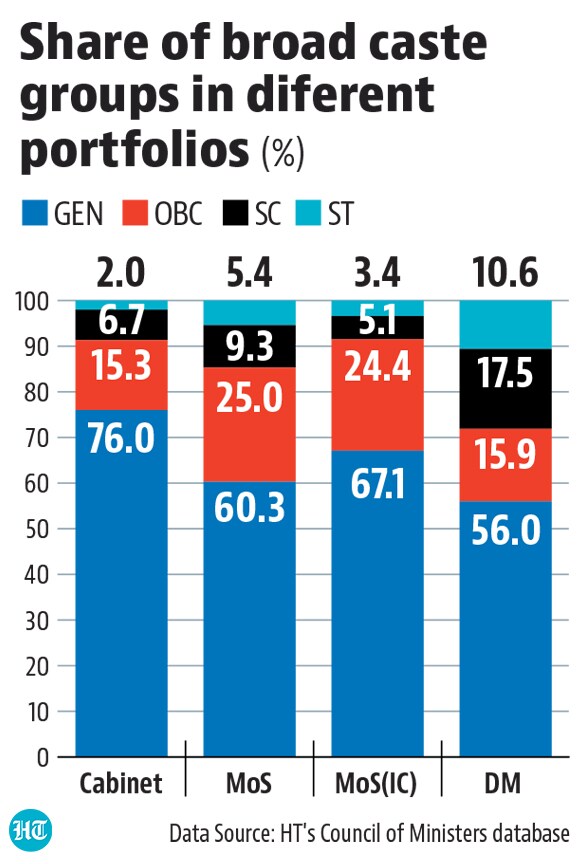
- But historically, ‘upper castes’ have a share of 67% in India’s council of ministers datasetOf 3,278 names in our database, 67.3% belong to castes other than OBC, SC and ST. OBCs have a share of 19.8% followed by SCs and STs at 8.6% and 4.2% respectively. Hindus have a share of 87% in this dataset while Muslims, Christian and Sikhs have a share of 6.3%, 2.8% and 3.4% respectively. This underlines the deep-rooted social inequality in India’s executive. A break-up of the database by hierarchy, namely, Cabinet rank, minister of state with independent charge, minister of state, and deputy ministers shows that non-SC/ST/OBC dominance is even bigger at higher positions.
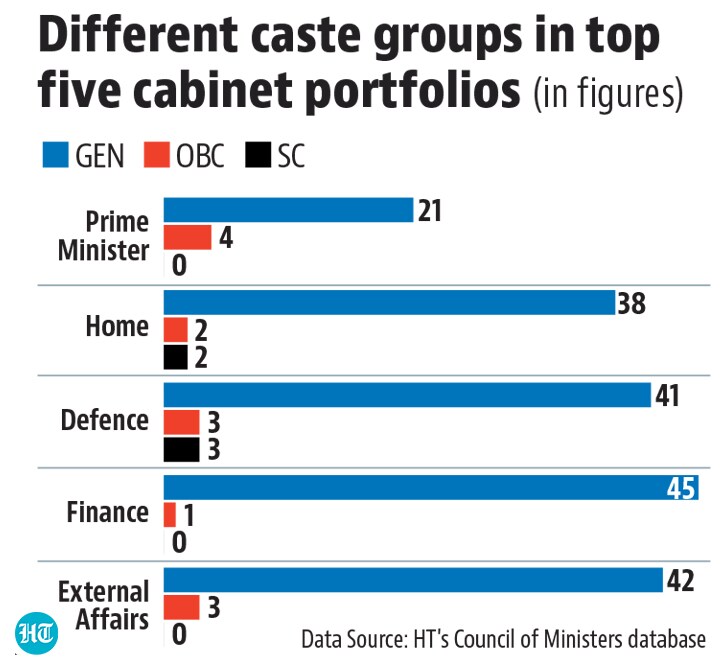
- ‘Upper caste’ dominance is even bigger when it comes to the ‘big-five’ in the cabinetThe Constitution only speaks about the prime minister being the head of the council of ministers and does not give any hierarchy among different Cabinet portfolios. However, this analysis has included the prime minister and ministers of home affairs, defence, finance and external affairs as the most powerful positions. There are only four OBC prime ministers in the dataset: HD Deve Gowda once, and Narendra Modi three times. A caste-wise analysis of the other four portfolios shows that out of a total of 42 individuals holding the home portfolio, 38 are from non-SC/ST/OBC castes, followed by two each from OBC (HD Deve Gowda and Giani Zail Singh) and SC groups (Sushil Kumar Shinde and Sardar Buta Singh). Out of 47 individuals who held the defence minister’s position, 41 came from non-SC/ST/OBC groups. The remaining six defence ministers were from OBCs (Mulayam Singh Yadav twice and Chidambaram Subramaniam once) and SC groups (Jagjivan Ram three times). Out of 46 individuals who held the finance portfolio, only one is OBC (Chidambaram Subramaniam), and the rest are from non-SC/ST/OBC backgrounds. Of the 45 unique names in the external affairs ministry,42 names come from non-SC/ST/OBC groups. The other three are from OBC groups (Bali Ram Bhagat, P Shiv Shankar, and Madhav Singh Solanki).
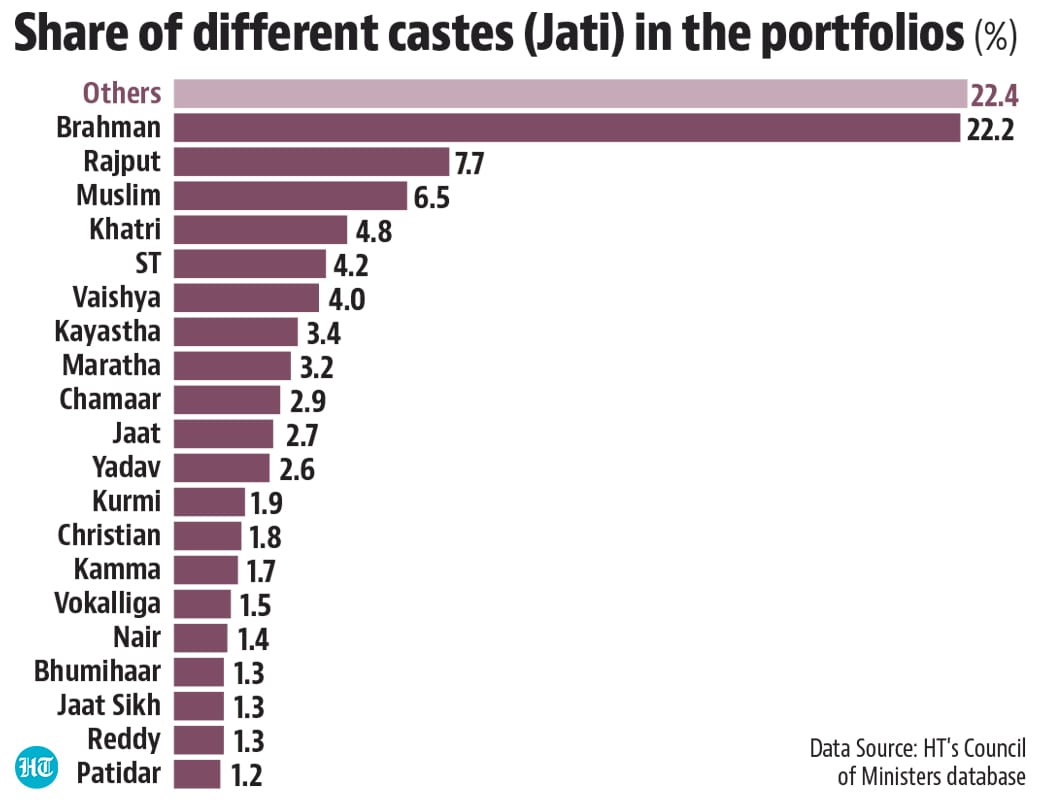
- 14 caste groups alone account for almost 70% of representation in the portfoliosBrahmins alone account for 22.23% in the overall Cabinet portfolios. The Rajput caste has a share of 7.67% followed by Khatris, Vaishyas, and Kayasthas at 4.84%, 4%, and 3.4% respectively. Marathas and Jats also have 3.23% and 2.7% share in the overall portfolios. We have not classified Muslims and STs into different castes. Just 20 out of hundreds of subcastes have a share of around 78% in the council of ministers dataset.