E-Paper



Number Theory: Has India’s labour market really improved post pandemic?
A comparison of the 2023-24 numbers with the 2018-19 (pre-pandemic) ones shows that the unemployment rate has almost halved

 Prefer HTon Google


India’s annual unemployment rate was flat between 2022-23 and 2023-24 at 3.2%. This is the lowest this number has been since 2017-18 in the Periodic Labour Force Surveys (PLFS). 2017-18 is the first year when the PLFS was conducted.

To be sure, unemployment rates were even lower in the Employment Unemployment Surveys (EUS) which used to be held every five years before the PLFS came into being. The unemployment rate was 2.2% in the last EUS which was conducted in 2011-12.
What makes the 2023-24 employment data better than the 2022-23 numbers – the PLFS follows a July to June survey year – is that the unemployment rate has remained flat despite a rise in the labour force participation rate (LFPR). LFPR is the share of population working or looking for work.
The steady fall in unemployment rate and rise in LFPR should be good news for India’s labour markets. It is really the case though? Here are some data points from the PLFS itself which argue to the contrary.
What is the broad trend in the Indian labour markets since 2017-18?
The simplest way to look at an economy’s labour market is to see it as a sum of the unemployed and employed who have salaried jobs, casual work or self-employment. The sum of all these heads would constitute the LFPR in the economy. What is not seen in these numbers is the share of population which has dropped out of the labour force for various reasons. A comparison of the 2023-24 numbers with the 2018-19 (pre-pandemic) ones shows that the unemployment rate has almost halved while the share of workers in the labour force has increased as a result of increase in self-employment.
 What is the broad trend in the Indian labour markets since 2017-18?The simplest way to look at an economy’s labour market is to see it as a sum of the unemployed and employed who have salaried jobs, casual work or self-employment. The sum of all these heads would constitute the LFPR in the economy. What is not seen in these numbers is the share of population which has dropped out of the labour force for various reasons. A comparison of the 2023-24 numbers with the 2018-19 (pre-pandemic) ones shows that the unemployment rate has almost halved while the share of workers in the labour force has increased as a result of increase in self-employment.
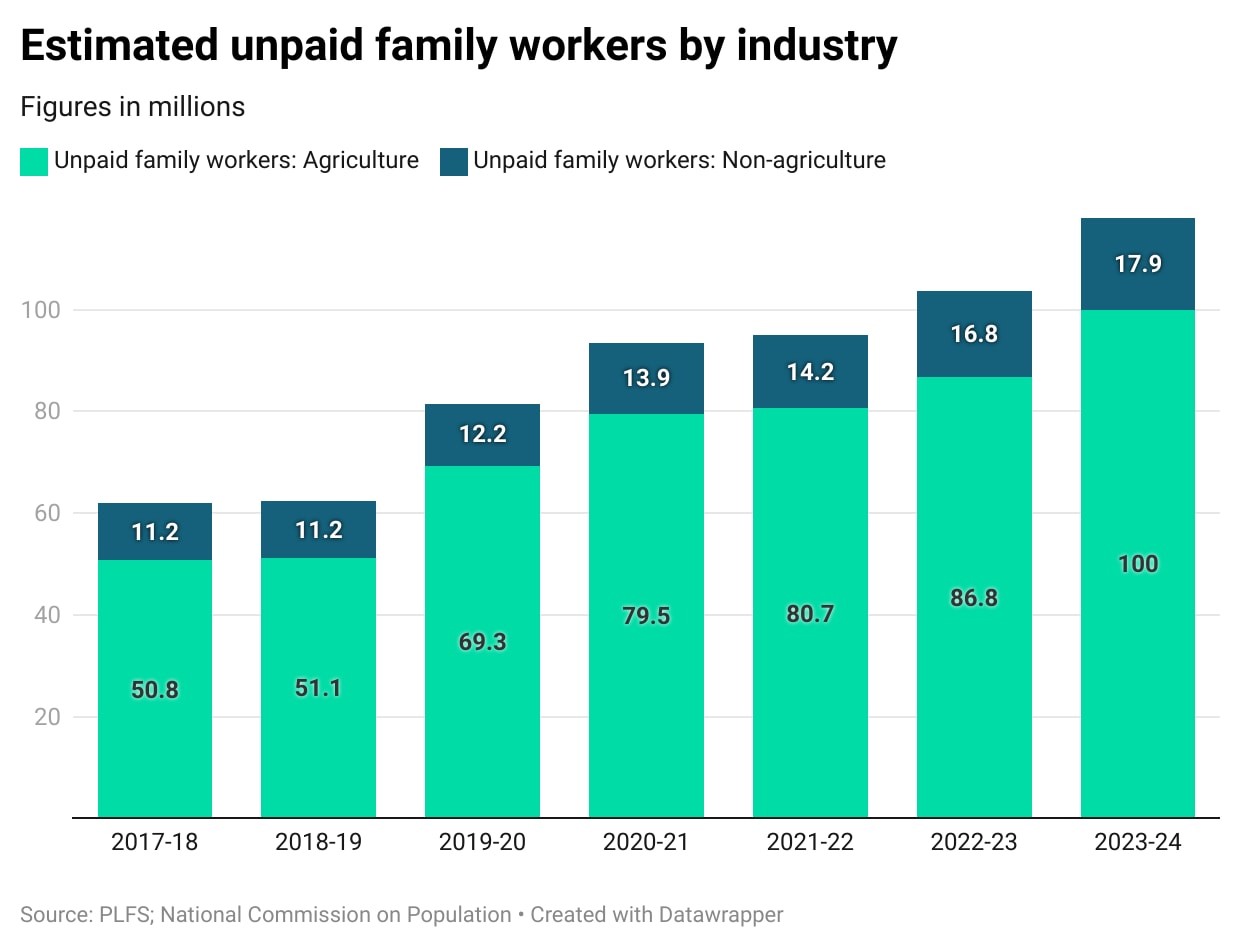
- But not all employment pays in India, and unpaid work has been risingCounter-intuitive as it sounds, this is not something completely unheard of in economics. A lot of family owned or small enterprises do not pay their workers, and it is by “saving” on this cost that they manage to stay viable. The PLFS explicitly records the incidence of unpaid employment in the Indian economy. A comparison of the 2018-19 and 2023-24 numbers shows that the share of unpaid workers in the labour force has increased 1.5 times between this period. This number has increased every year between 2018-19 and 2023-24.
- India’s farms have been a fertile ground for unpaid employment post-pandemicA good way to understand unpaid work is to classify it between agriculture and non-agriculture. This is because the former has been known to be a preserve of what is known as disguised unemployment in India where a worker claims to be working (in the farms) but isn’t contributing much to overall production. Extrapolating the PLFS ratios using India’s population projections shows that 88% of the extra 56 million unpaid workers which the economy added between 2018-19 and 2023-24 were added in agriculture. To be sure, agriculture was the mainstay of unpaid workers in the Indian economy even pre-pandemic, but the problem clearly seems to be growing.
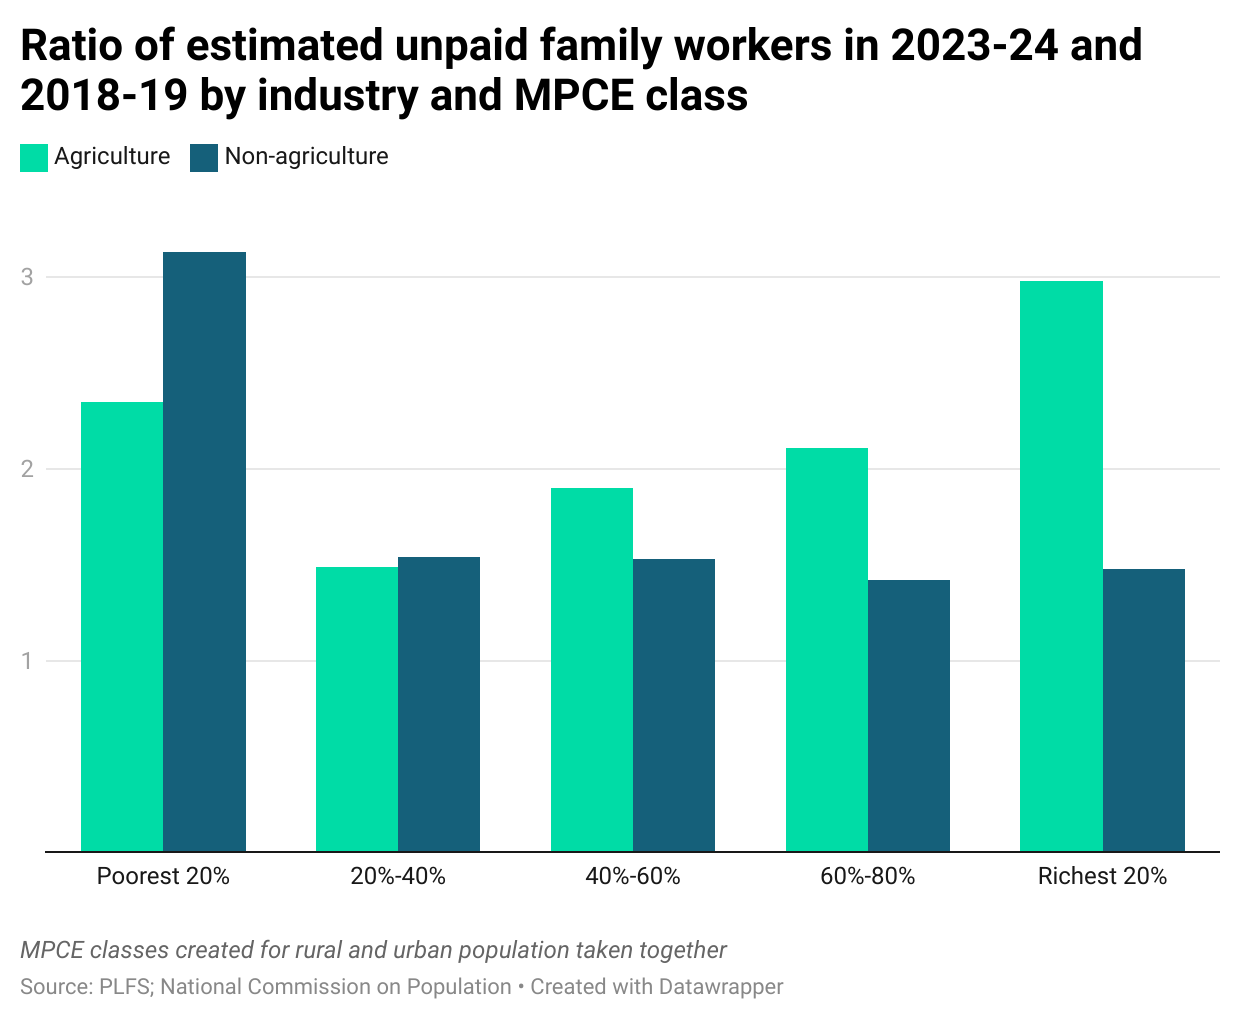
- The relatively rich have seen the largest increase among unpaid agricultural workersThis is yet another interesting statistic from the PLFS data. A classification of agricultural and non-agricultural unpaid workers by monthly per capita expenditure (MPCE) levels – they are the best proxy for economic well-being – shows that the relatively richer agricultural unpaid workers show a much larger proportional increase in their numbers between 2018-19 and 2023-24. The relationship is the other way round among the non-agricultural workers. Is it the case the relatively rich have joined the ranks of the disguised unemployed by joining the agricultural workforce to prevent the stigma of unemployment? The question deserves careful engagement.
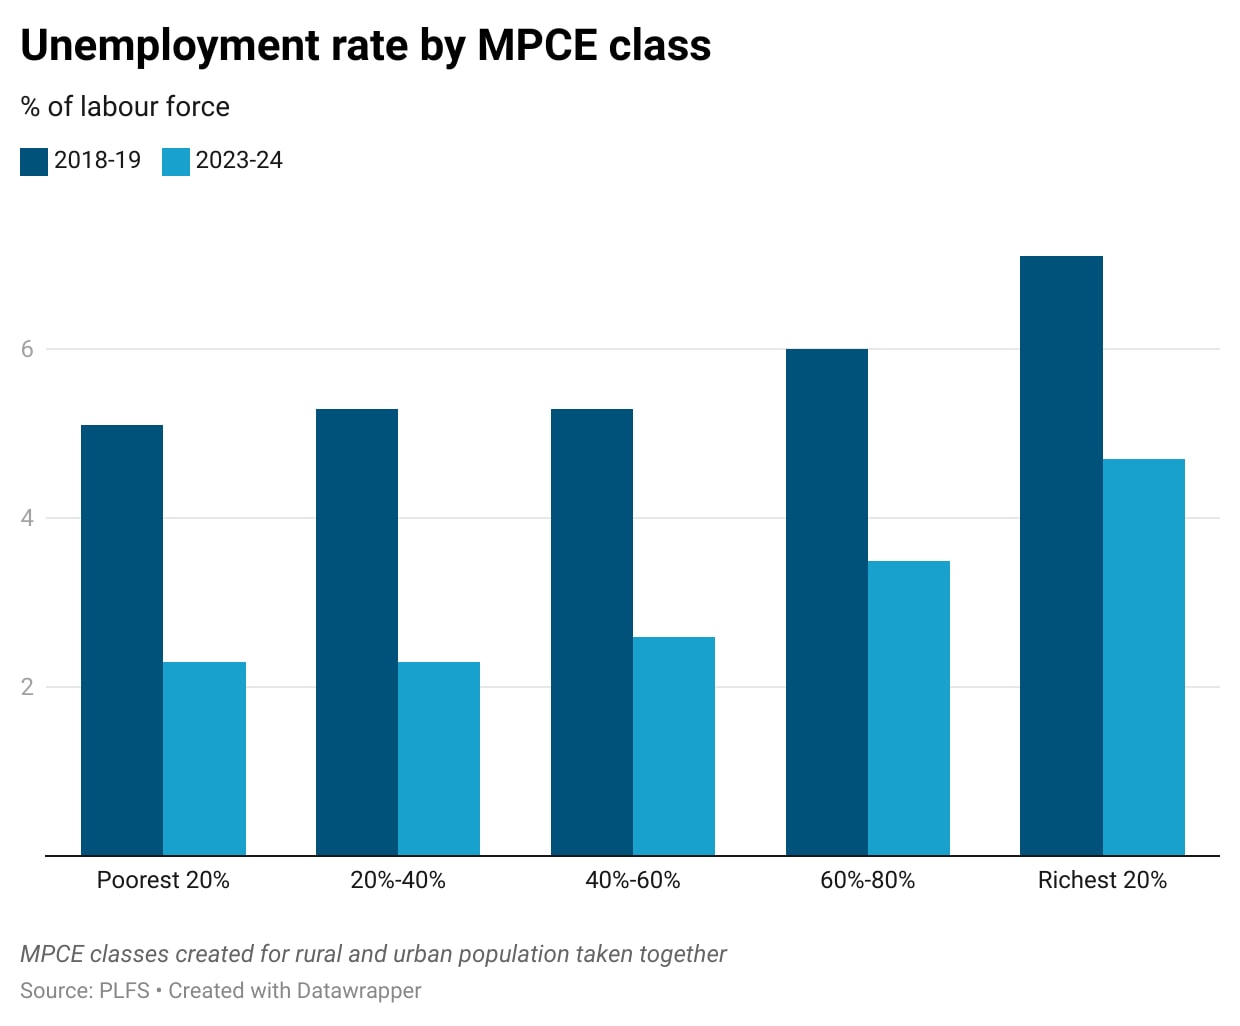
- Unemployment has anyways always been unaffordable for the poor in IndiaThis is the most important statistic to keep in mind while looking at data on Indian labour markets. Lack of a social security/unemployment allowance framework beyond basic food entitlements means that not working is a choice which the poor cannot really afford in India. This is borne out for a class break-up of unemployment rates, which increases with MPCE levels. A comparison of 2018-19 and 2023-24 unemployment rates shows that not only is the relationship still intact, unemployment rates have seen a lower fall among the rich between these two years.
- There is nothing wrong in praising the fall in unemployment rates despite a rising LFPR in India in the last few years. But when read with the rising trend of the relatively well-off populating the ranks of unpaid workers in agriculture one cannot but ask the question whether India has moved from a crisis of jobless growth in the first decade of the century to growing number of lacklustre jobs which are being shunned by those who can afford to do so.