
 E-Paper



What we know about caste inequality in India | Number Theory
.
Updated on: May 5, 2025, 08:33:34 IST

 Prefer HTon Google
Share via


Copy link

The new caste census will give us a detailed caste-wise break-up of India’s population. Whether or not the census schedule is significantly altered to capture caste-wise economic inequality – the census does collect some information such as agricultural and non-agricultural employment and household amenities – remains to be seen. However, existing government surveys do give us some idea about the role of caste in economic inequality in India. Here is a summary snapshot of what the data tells us.
What we know about caste inequality in India
 Consumption inequality by caste is smaller than asset inequalityThe National Sample Survey Office (NSSO) releases two reports that can be used to track social group wise inequality in assets and consumption spending. The first is given in the All India Debt and Investment Survey (AIDIS) and the other in Household Consumption Expenditure Survey (HCES). India does not have an official database on income. The latest HCES data is from August 2023-July 2024 and the AIDIS gives asset data as on June 30, 2018. If one were to look at inequality among four major social groups – Scheduled Caste (SC), Scheduled Tribe (ST), Other Backward Classes (OBC) and non-SC-ST-OBC – in assets and ownership, inequality in the former seems to be larger than the latter. This can be seen in their respective share in assets/spending relative to their share in population, which is the share in assets/spending divided by share in population. To be sure, the economic inequality seen in both the HCES and AIDIS could be underestimates because NSSO surveys do not really count the rich. For example, the highest monthly per capita expenditure recorded in the HCES was ₹1.86 lakh. Similarly, the highest asset value for a household in the AIDIS was ₹114.8 crore.
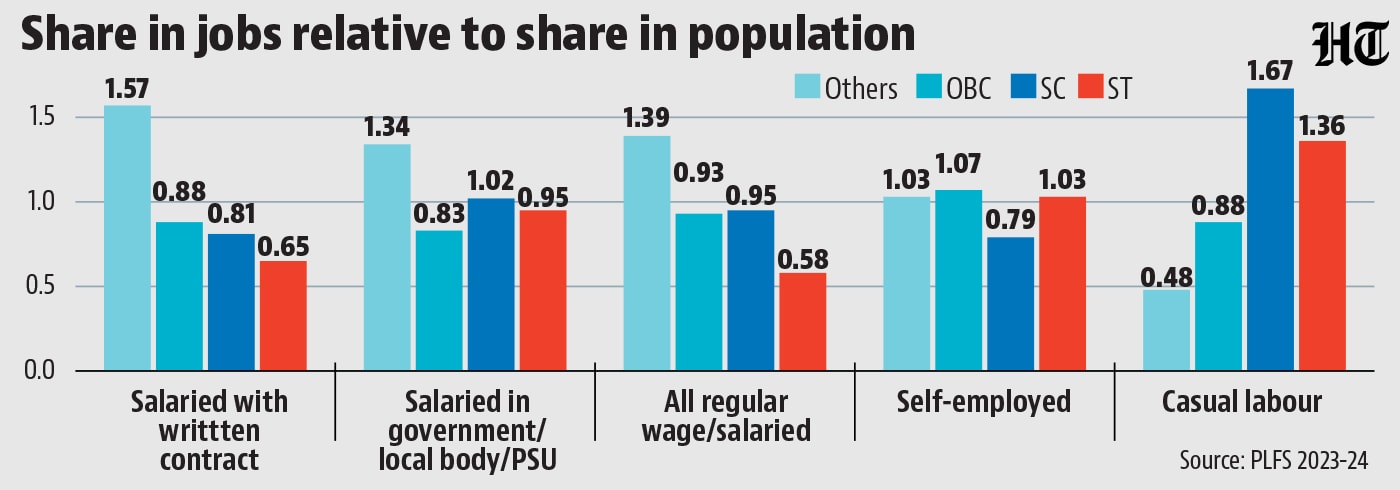
- OBCs. SCs and STs have a disadvantage when it comes to salaried jobsPeriodic Labour Force Survey (PLFS) is the official source of employment statistics in India. The latest PLFS cycle for which data is available is July 2023-June 2024. The PLFS gives a break-up of what kind of jobs people have. A basic classification across three broad categories -- salaried, self-employment and casual work -- shows that than non-SC-ST-OBC groups have a higher relative share than OBCs and SCs, who in turn have a much higher relative share than STs. While the STs are over represented in both self-employment and casual work, OBCs are over represented in self-employment, which could well be a result of their larger employment in agriculture. A break-up of salaried jobs by written contract and whether they are government jobs shows a bigger relative disadvantage for OBCs than in all salaried jobs, suggesting that their access to better salaried jobs could be even lower. PLFS data on earnings shows that salaried jobs are the best paying in India while causal work pays the least. While the relative disadvantage of OBCs could be attributed to their reservations not being proportionate to population share, the bigger disadvantage for STs than SCs shows that even proportionate reservations cannot guarantee equality.
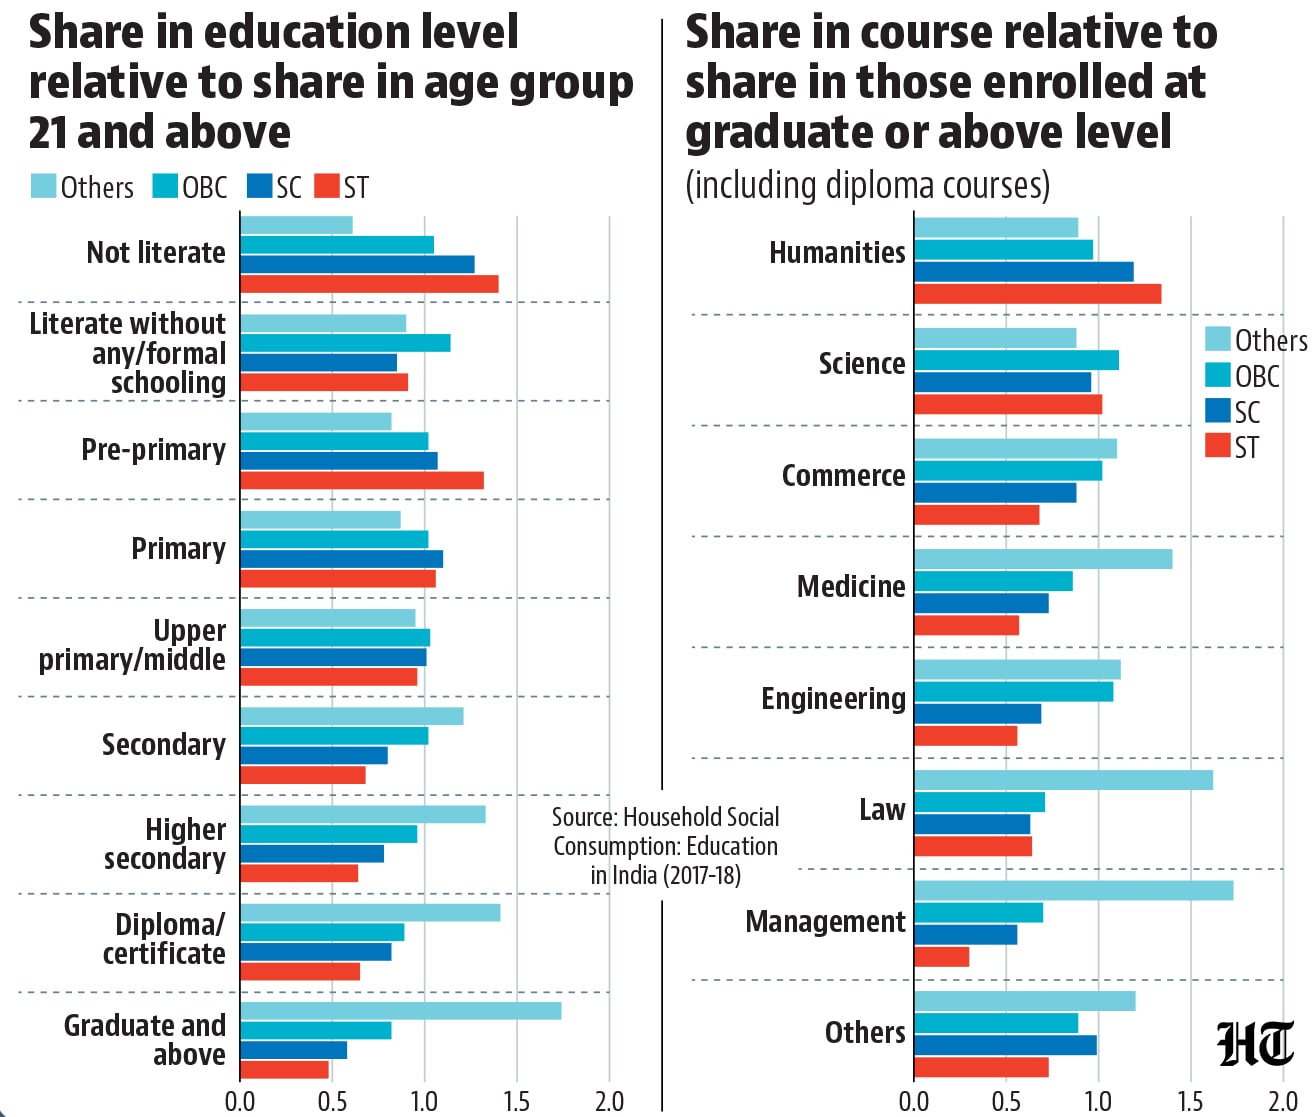
- Caste inequality in education becomes bigger in technical educationEducation is the most important determinant of upward mobility in today’s age. NSSO has a report that captures spending on education by households in India and also records educational status of household members. The data shows that the non-SC-ST-OBC population is over represented in higher education while it is the other way round for SCs, STs and OBCs. The data also shows that even when among people who have had access to higher education, the likelihood of training in technical disciplines such as medicine, engineering and management is higher for non-SC-ST-OBC groups than others. On the other hand, SC, ST and OBC population is over-represented in graduate programmes in humanities. To be sure, SCs and STs are more underrepresented in technical courses than OBCs. Given the fact that technical education is more expensive, it could very well be the result of economic inequality determining the purchasing power for education.




Unlock a world of Benefits with HT! From insightful newsletters to real-time news alerts and a personalized news feed – it's all here, just a click away! -Login Now!


