E-Paper



Why are households borrowing more | Number Theory
While there has been a lot of alarmist commentary on the rise in household debt, the analysis here stopped short of painting the trend as necessarily bad

 Prefer HTon Google


These pages have discussed the trend of rising household credit and the headwinds it has generated for household savings in the Indian economy. While there has been a lot of alarmist commentary on the rise in household debt and the associated fall in savings, the analysis here stopped short of painting the trend as necessarily bad. What it did point out was that consumption and GDP had become more growth-dependent, and it noted that there was no sign (yet) of households not being able to pay back the loans they have taken. This disclaimer notwithstanding, there is at least one data source – the urban Consumer Confidence Survey (CCS) conducted by RBI – which can be used to argue that urban households have seen a skew in the income-spending balance towards the latter in the past few years.
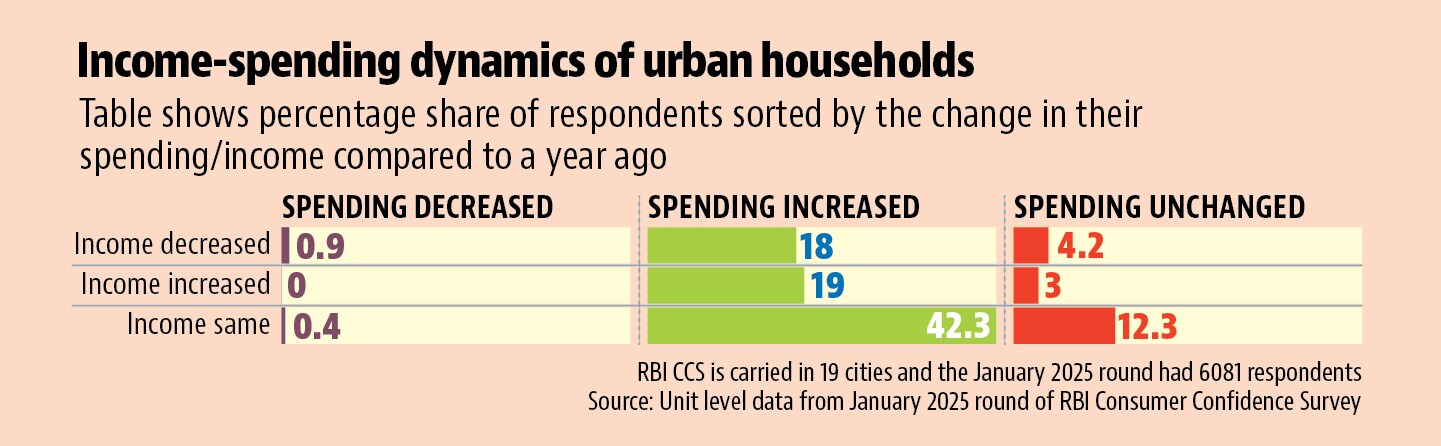
 Almost two-thirds of the respondents saw their spending rising when income fell or remained unchangedRBI publishes unit-level data from the CCS with some lag. The latest period for which unit level data is available for the CCS is for the January 2025 round which was published after the conclusion of the February 2025 Monetary Policy Meeting. There has been one more CCS round after that. If one uses this unit-level data to cross-tabulate two key responses – change in income level and spending compared to a year ago – one can distribute households into a 3x3 matrix with rows and columns being income/spending increasing, decreasing or remaining the same. Almost two-thirds (64.4%) of the 6081 respondents in the survey had their spending move unfavourably compared to their income in the last year. More than 40% of the respondents saw their spending rising while their income remained the same, while the remaining saw spending rise or remain the same while incomes fell. To be sure, this data only tells us about the direction of income and spending rather than their magnitude. This means that we do not know whether the former has necessarily overtaken the latter, which would mean households finances running into crisis and lead to distress-driven lending. See Chart 1:
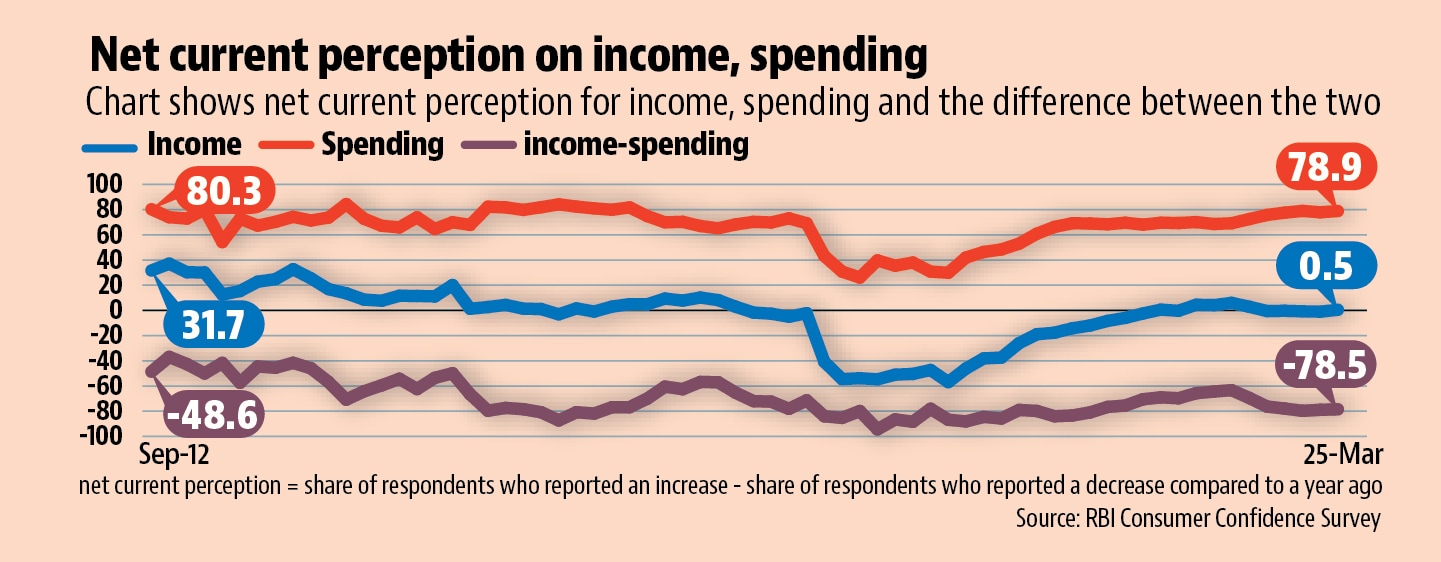
- The gap between net current sentiment on income and spending has grown once again in the recent roundsIf one were to compare the net current perception – difference between the share of respondents who reported an increase and decrease compared to last year – on income and spending in all CCS rounds so far, the gap between income and spending seems to have become more unfavourable in the past few rounds after having improved continuously from its pandemic high. Another occasion which saw the gap between perception in spending and income rising was in the aftermath of the back-to-back shocks of demonetisation and the implementation of Goods and Services Tax on the economy. The larger point is, while there is no conclusive evidence, the spending-income balance might have deteriorated in the recent period. See Chart 2:
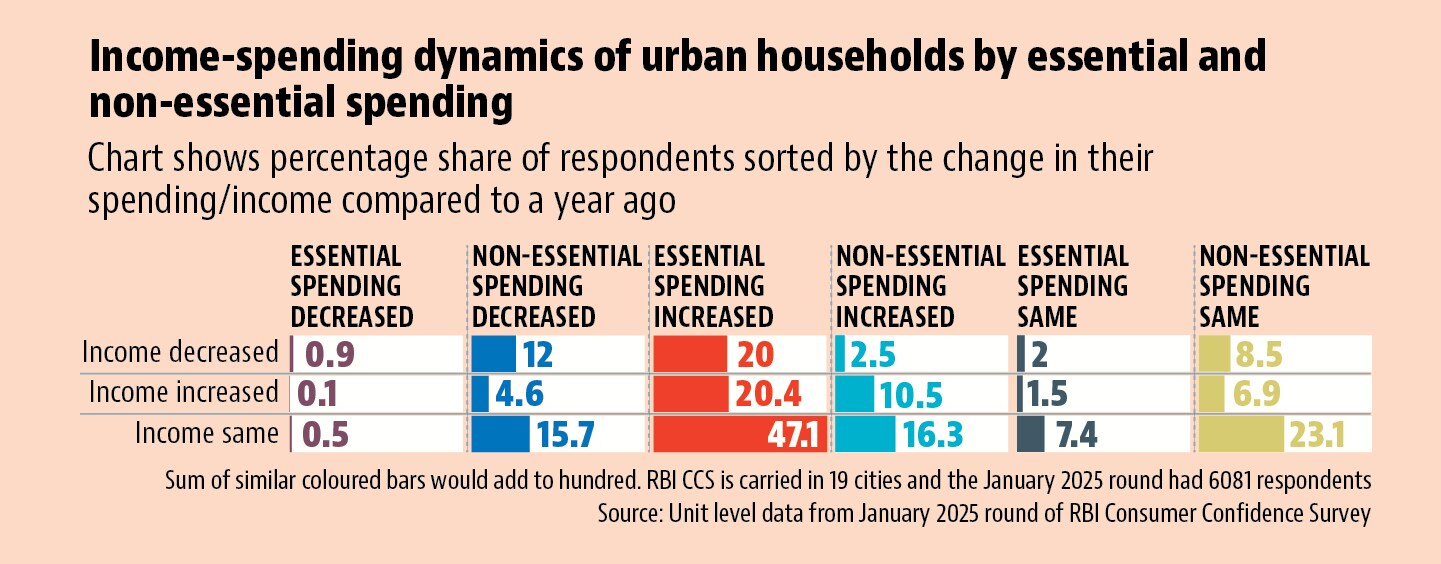
- Essential spending has seen a bigger rise than non-essential spendingCCS also asks questions on essential and non-essential spending by households. A comparison of essential and non-essential spending with income levels on the same lines as overall spending shows that the former has increased at a faster pace than the latter for households irrespective of the change in their income. This suggests rise in essential spending has forced households to hold back on their discretionary or non-essential spending. This is the opposite of what one would expect in case of increasing conspicuous consumption in an economy. See Chart 3:
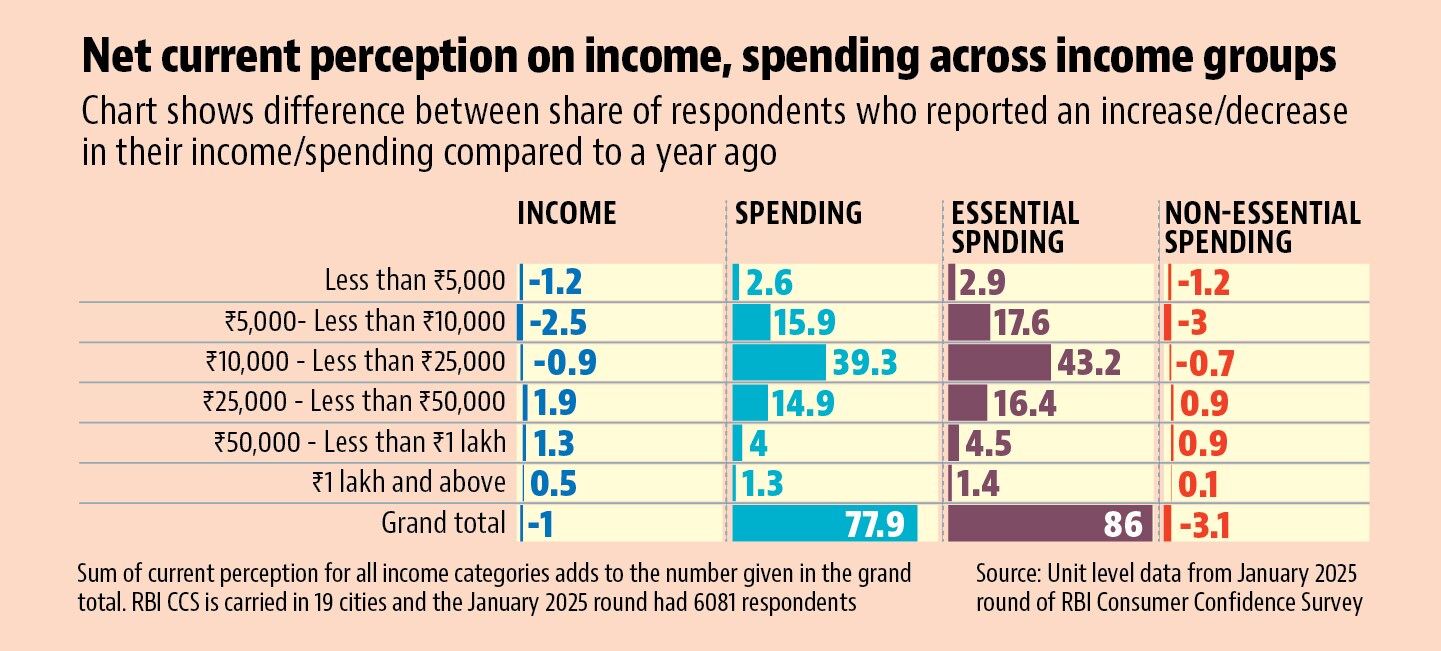
- A class-wise comparison of spending and income perceptions gives the best idea about what might be happeningBreaking down income and spending perceptions by income categories shows that the top three income-categories report an improvement in income and non-essential spending while the bottom three report a worsening in both. The trend in perception on overall and essential spending shows an inverted-U shape where it rises for the middle-income groups and is low at both extremes. While CCS is far from a representative data set (it does not even cover rural India) it does give an impression that that the recent rise in indebtedness of households could be a mix of the poorer ones trying to bridge the deficit between their incomes and essential spending and the richer ones borrowing to increase their non-essential spending amidst increasing incomes. The former is a bad thing and the latter a good development for the economy. Of course, we need more data to get a better picture of the dynamics. See Chart 4: