
 E-Paper



Niti Aayog health index 2021: See ranking of states and union territories based on performance
The health index released by government think tank Niti Aayog said that Tamil Nadu and Telangana have emerged as the second and third best performers, respectively, on health parameters.

 Prefer HTon Google


Government think tank Niti Aayog on Monday released the fourth edition of its health index, which ranked states based on overall health performance. Kerala was ranked as the best performer on top, while Uttar Pradesh was the worst.
The report was divided in three parts - larger states, smaller states and union territories. Among the smaller states, Mizoram was the best performer and Nagaland was at the bottom.
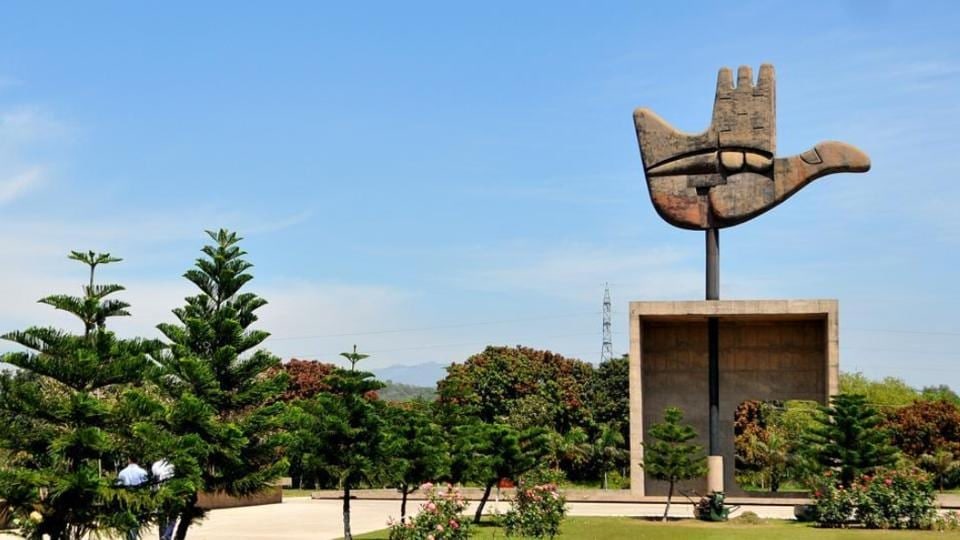
Among the union territories, Chandigarh was on top, followed by Dadra and Nagar Haveli at number 2 and Delhi at number 3. Puducherry was the worst overall performer, according to the Niti Aayog report.
The fourth round of the Health Index took into account the period 2019-20 (reference year).
Niti Aayog’s health index is a weighted composite score incorporating 24 indicators covering key aspects of health performance.
Here’s the health index released by Niti Aayog
Larger States:
| Base Year | Reference Year | |
| Kerala | 77.53 | 74.65 |
| Andhra Pradesh | 60.84 | 65.31 |
| Maharashtra | 61.76 | 64.53 |
| Gujarat | 62.61 | 63.72 |
| Punjab | 65.83 | 63.41 |
| Himachal Pradesh | 61.84 | 63.10 |
| Jammu and Kashmir | 61.02 | 62.92 |
| Karnataka | 59.39 | 61.77 |
| Tamil Nadu | 64.05 | 60.50 |
| Telangana | 56.12 | 59.42 |
| Haryana | 47.59 | 54.08 |
| Chhattisgarh | 52.69 | 53.97 |
| Jharkhand | 48.25 | 53.67 |
| Assam | 45.84 | 50.02 |
| Rajasthan | 37.35 | 43.23 |
| Uttarakhand | 44.61 | 39.61 |
| Madhya Pradesh | 40.77 | 38.69 |
| Odisha | 40.19 | 36.35 |
| Bihar | 39.10 | 32.43 |
| Uttar Pradesh | 34.44 | 29.16 |
Smaller States:
| Base Year | Reference Year | |
| Mizoram | 73.70 | 74.98 |
| Manipur | 57.78 | 60.59 |
| Meghalaya | 56.83 | 55.95 |
| Goa | 53.13 | 51.90 |
| Sikkim | 53.20 | 50.50 |
| Tripura | 43.51 | 46.38 |
| Arunachal Pradesh | 49.51 | 46.07 |
| Nagaland | 37.59 | 38.51 |
Union Territories:
| Base Year | Reference Year | |
| Chandigarh | 58.35 | 67.08 |
| D&N Haveli | 45.41 | 60.73 |
| Delhi | 59.84 | 52.22 |
| Daman & Diu | 48.32 | 51.04 |
| Lakshadweep | 54.58 | 50.22 |
| A&N Islands | 55.74 | 49.89 |
| Puducherry | 35.51 | 31.87 |
The report has been prepared in collaboration with the Ministry of Health and Family Welfare with technical assistance from the World Bank.


