E-Paper



Number Theory: What Bihar caste census data does not tell us
Without taking away anything from the importance of the data which has been released, here are some aspects which have been left unaddressed
Updated on: Nov 9, 2023, 13:05:00 IST

 Prefer HTon Google
Share via


Copy link

By publishing data on population by sub-caste, and socio-economic attributes, Bihar has become the first state in India to give official data at the sub-caste level. While unit-level release of these caste survey data will lend itself to a far more detailed analysis, even the released numbers provide a lot of information about socioeconomic inequality at not just the broad social group-level, but also at the level of sub-castes.
What Bihar caste census data does not tell us
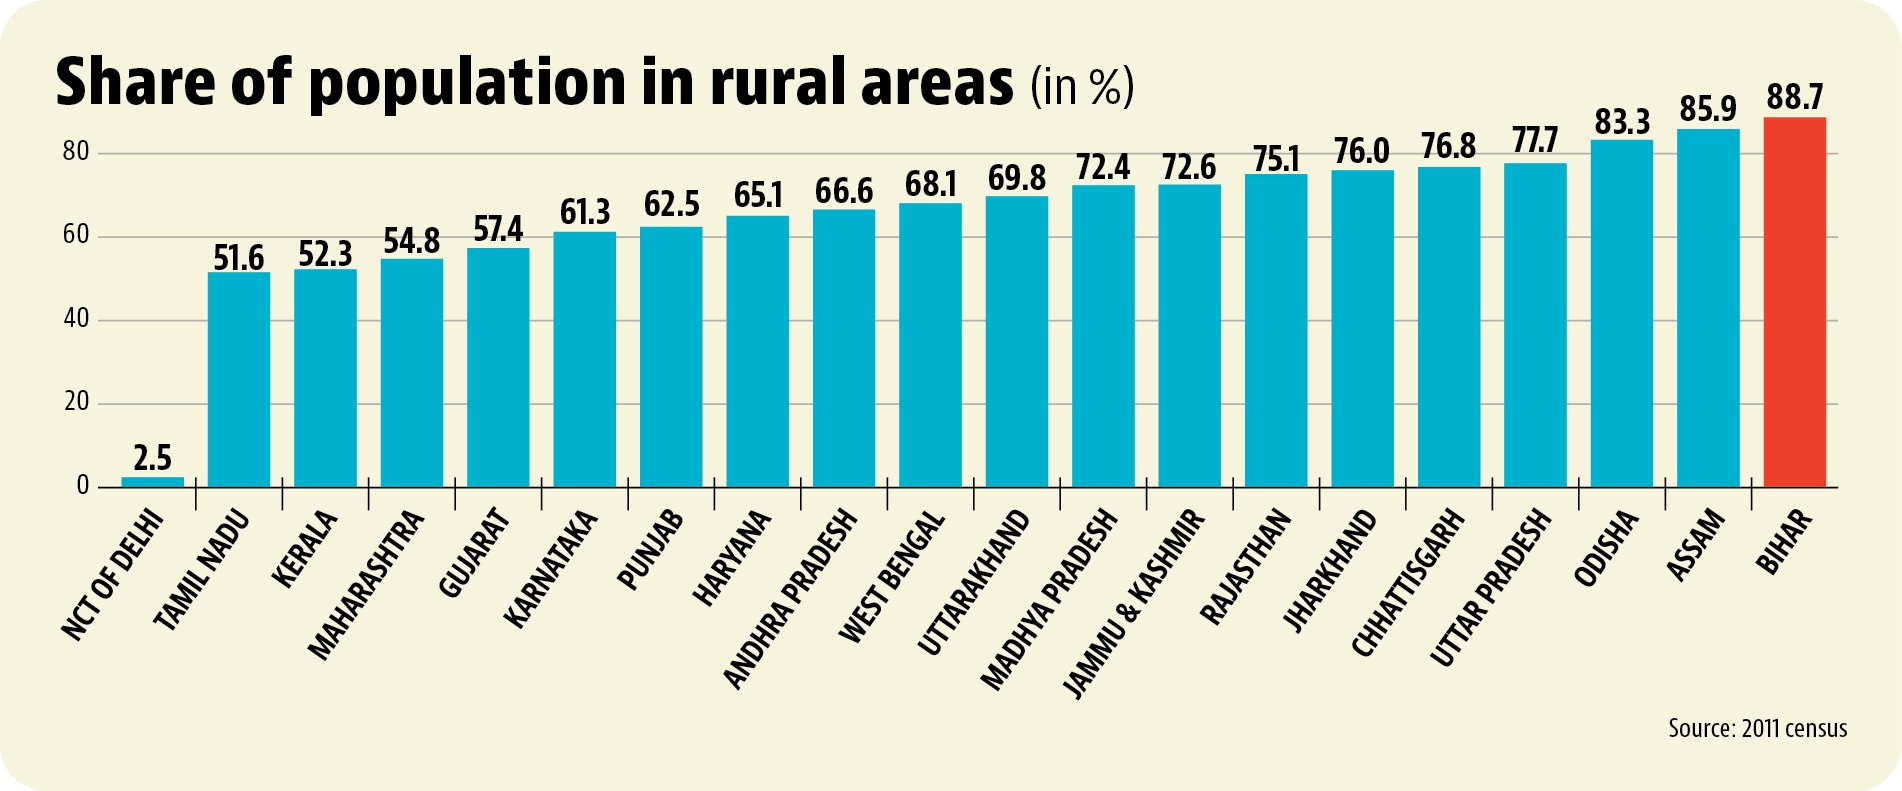
 Number Theory: Biggest omission in the data is a rural-urban break-upIf there is one thing that stands out in the caste survey data which was released on November 7, it is the fact that more than one-third of the state’s households earn less than ₹6,000 per month, which is what the state government has taken as a threshold for being poor. Data shows that the share of poor households is as high as 25% even among the population which does not belong to Scheduled Caste (SC), Scheduled Tribe (ST), or Other Backward Classes (OBCs). This suggests that there is more to poverty in the state than just the caste background of a person. Here is where a rural-urban split in the data would have helped. According to the 2011 census – the 2021 census has been delayed indefinitely – Bihar was the most rural among India’s states with a population of at least 10 million.
- Rural incomes are lower than urban incomes across IndiaNot only is this intuitive, multiple surveys show this conclusively. For example, the latest Periodic Labour Force Survey (PLFS) shows that urban incomes across work categories were significantly higher than rural incomes in the country. The advantage of urban incomes over rural incomes holds for different social groups as well.
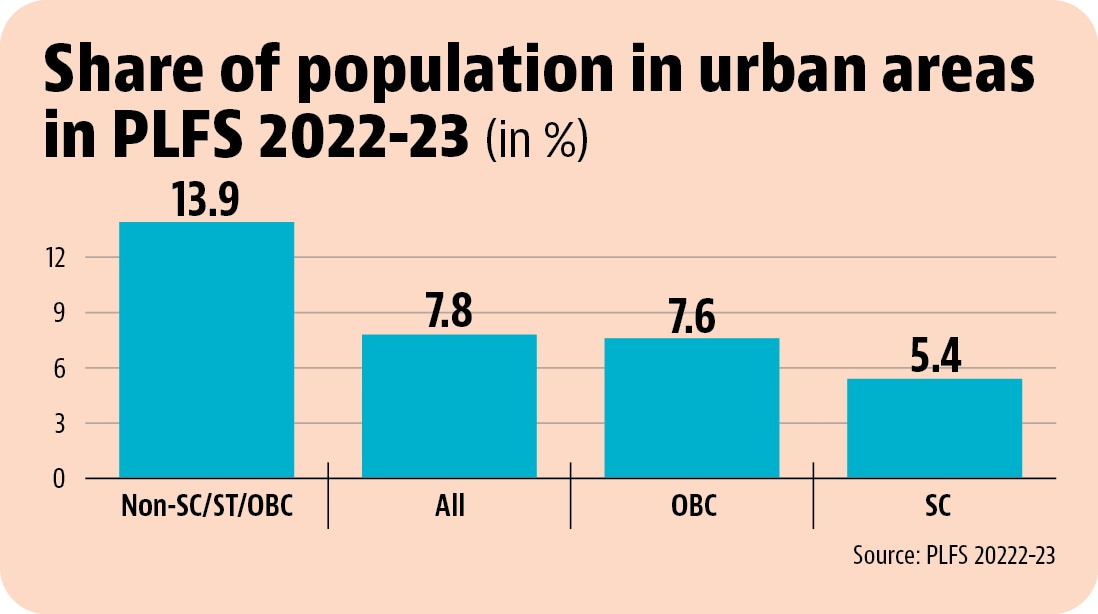
- PLFS data shows that upper castes are the most urbanised social group in Bihar2022-23 PLFS data shows that the population which does not belong to the SC/ST/OBC group is the most urbanised in Bihar. To be sure, most urbanised is a relative term in this case because Bihar’s 13.9% urban share for non-SC/ST/OBC population is still lower than the national average of urban population for India. It is entirely likely that difference in rural-urban domicile is a much bigger driver of poverty, and perhaps wealth, in the state than social background of a person in Bihar. For example, anybody who knows that state will agree that Kayasths, who have the lowest poverty ratio among all sub-castes in the state, are the most urbanised social group in Bihar. Had the Bihar caste census published these results at the sub-caste level, it would have provided valuable information about social differentiation in urbanisation in the state.
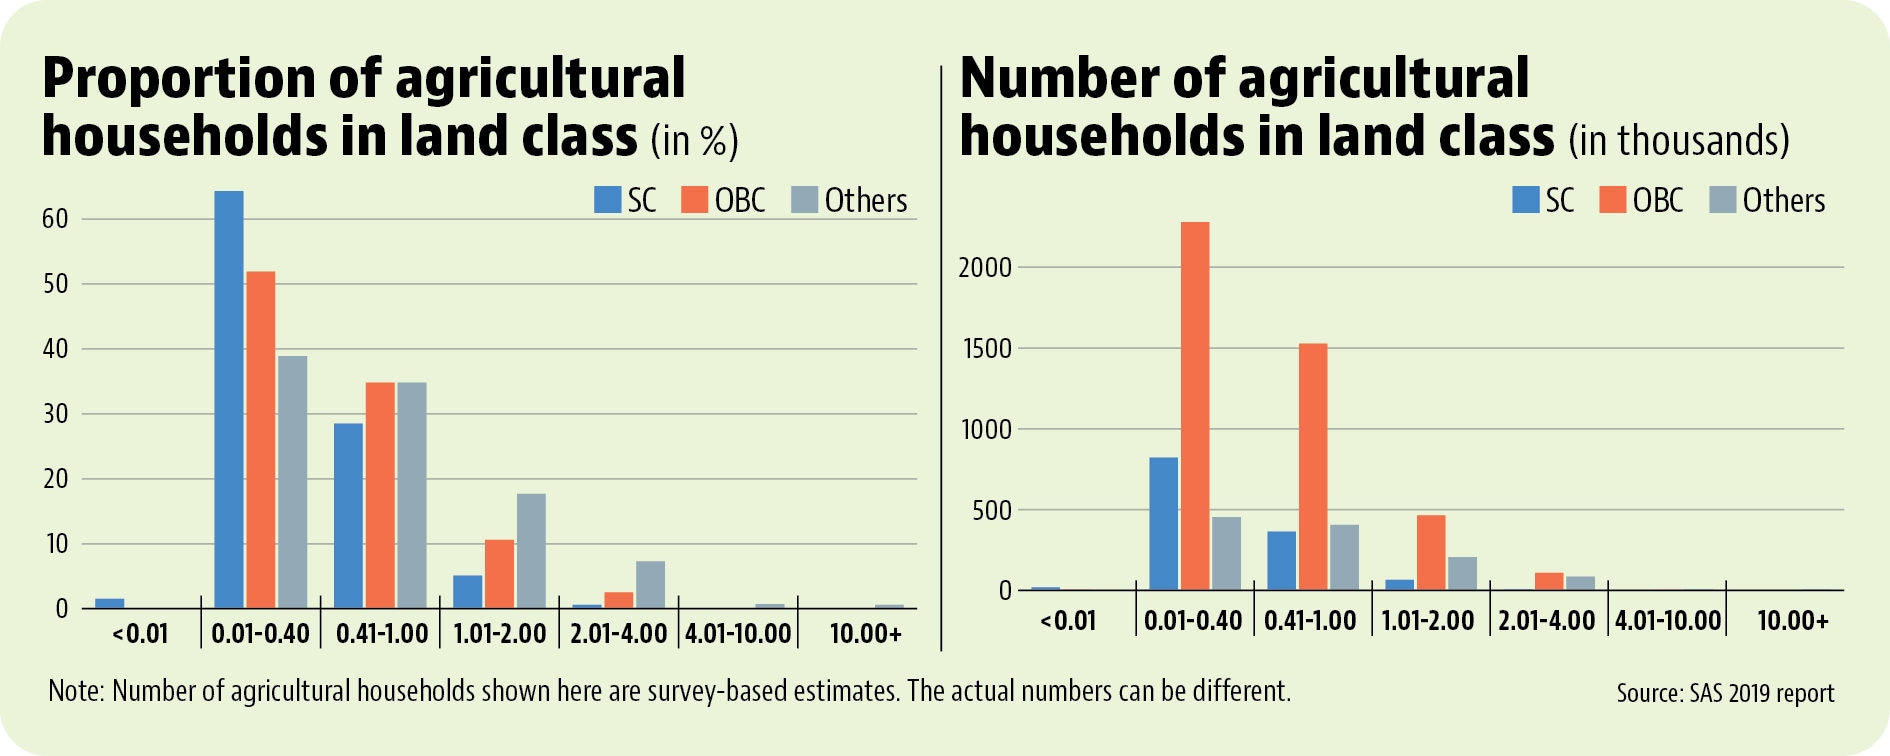
- Lack of rural-urban data also keeps the question of agrarian transformation in the dark19.9% of Bihar’s GSDP came from agriculture in 2022-23. In July 2022-June 2023, 49.6% of the state’s workforce was engaged in agriculture. Both these numbers are significantly higher than the national average of 15.1% and 45.8% respectively. This also makes it clear that unless things improve on the agrarian front, upward mobility will continue to elude the state. However, any programme which seeks to increase incomes in agriculture could have a differential impact in case of unequal land ownership. While the political narrative has always harped on an upper caste dominance in land ownership, official data suggests that the balance of land ownership is not as unfavourable to OBCs as it is made out to be. Data from the Situation Assessment Survey (SAS) of agriculture conducted in 2018-19 shows that while the share of agricultural households – it is defined as rural households with at least one member self-employed in agriculture and agricultural output (including animal farming) of at least ₹4,000 in 2018-19 – among OBCs with a higher size class of land is lower than the non-SC/ST/OBC population with a higher size class of land, in absolute terms the number of OBC agricultural households owning bigger land holdings is larger than the non-SC/ST/OBC group. It has often been argued that dominant OBCs – they would come under the Backward Classes in the Bihar caste census – own much more land than Extreme Backward Classes. By not collecting and publishing sub-caste wise land ownership data, the Bihar caste census has let go of an important opportunity to tell us more about this inequality.