E-Paper



What India has to do to become a developed country
While India becoming the third largest economy in the new few years is almost a given, it will take more than GDP growth for India to become a developed country

 Prefer HTon Google


Speaking from the ramparts of the Red Fort on August 15, Prime Minister Narendra Modi reiterated his guarantee of India becoming the third largest economy in the world in his third term. Modi also said that India will become a developed country by 2047, the 100th anniversary of the country’s independence.
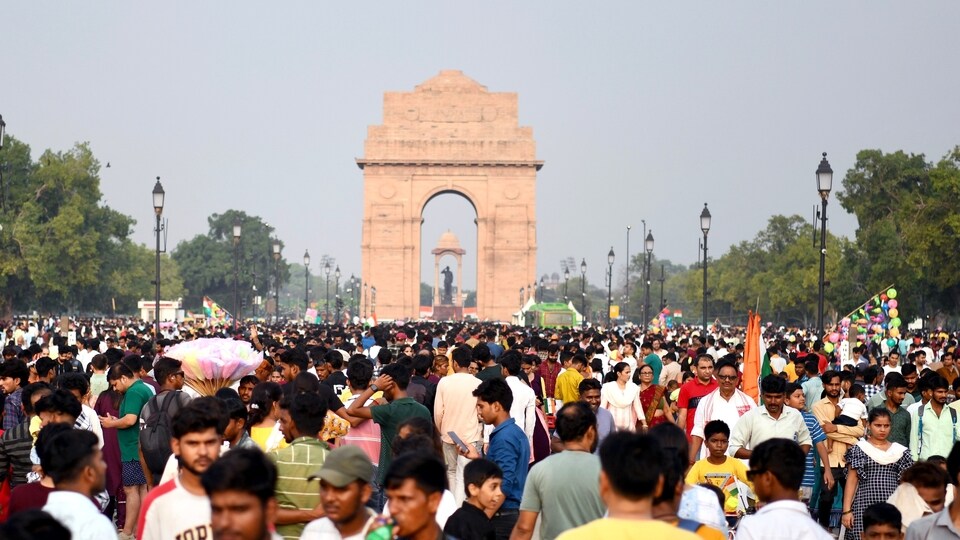
While India becoming the third largest economy in the new few years and its absolute GDP reaching much higher levels by 2047 is almost a given, it will take more than GDP growth for India to become a developed country.
It is also useful to remember that India significantly lags behind not just developed countries but also China on a host of important indicators other than per capita GDP. The analysis that follows lists 10 such parameters -- areas where India has to focus its efforts on to bridge the gap and become a developed country. To be sure, none of this is impossible, although achieving them will require the Indian economy to undergo the rapid transformation the Chinese one did in the 1990s and 2000s. It’s the reason policy makers as well as administrators, including Prime Minister Narendra Modi, emphasise the importance of the coming two decades.
The analysis uses the average/individual values for G7 countries (Canada, France, Germany, Italy, Japan, United Kingdom and United States) and China.
 The average per capita GDP of G7 countries is 20 times that of IndiaPer capita GDP is the basic economic indicator of well-being levels in the world. India’s per capita GDP was $9,073 in current prices (in purchasing power parity terms that adjusts for different prices of products in different countries) in 2022-23 according to the IMF’s World Economic Outlook (WEO) database. This is just 13.5% of the G7 average and 39% of China’s per capita GDP. As was shown in the two-part series referred to earlier, the per capita GDP gap for India will remain significant vis-à-vis the US and China by 2047.
- India must reduce its share of agricultural employment to increase per capita GDPIndia’s low per capita GDP is a direct result of its inability to shift workers from agriculture to more productive and remunerative sectors. Agriculture accounts for less than 15% of GDP but still employs more than 40% of the workforce. A comparison with G7 and China shows this clearly. In countries such as the US, UK or Canada, the share of agriculture in total employment is less than 10%. China has been able halve its share of agricultural employment from 50% in 2000 to 24% in 2021.
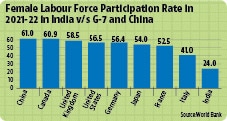
- Improving female labour force participation is another challengeIndia’s female labour force participation (LFPR) was 24% for women aged above 15, far behind the G7 countries where the lowest is 41% in Italy, in 2021-22 according to World Bank data. Canada has the highest female labour force participation at 61%. India’s female LFPR has increased by one percentage point in 2022, after a brief dip during Covid-19 lockdown. The country, however fairs poorly on this indicator in comparison with not just developed nations but with China too, which is on par with Canada at 61% of its women participating in the workforce.
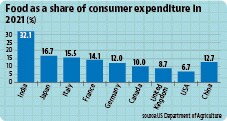
- Low per capita GDP means food eats into a large part of household budget32.7% of average annual consumption expenditure of Indians was on food in 2021, according to data from US Department of Agriculture. This number is just 6.7% in the US. The share of food in consumption expenditure in India is higher than that in all G7 countries and China.On the other hand, Chinese consumers are on par with their developed nation counter parts, spending 12.7% of their expenditure on food, a little more than the German households, who spend 12% of their expenses on food.
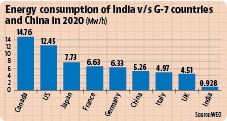
- G7 countries consume eight times more energy per capita than IndiaIndia’s per capita energy consumption, according to data from the International Energy Agency, was 0.928 Megawatts per hour (Mw/h) in 2020. The lowest energy consumed per capita among the G-7 nations was 4.5 Mw/h in the United Kingdom. China’s per capita electricity consumption is 5.2 Mw/h at par with the advanced economies. While India’s per capita energy consumption has been increasing, it will need to increase to much higher levels to support developed country living standards. To be sure, India, unlike a lot of developed countries does not need to spend very high amounts of energy in heating homes, but energy demand for cooling houses and offices – they have a direct positive bearing on productivity – will have to increase to support better living standards.
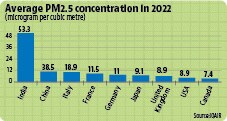
- But energy consumption cannot rise at the cost of the environmentIndia is also very far from becoming a developed country in terms of the quality of life that depends on the state of the environment. In 2022, India was the eighth most polluted country among 131 countries for which IQAir, a Swiss air quality technology company, generated these rankings, worse than all G7 countries and China, which was ranked 25th. To be sure, rankings hide the distance India has to cover to make its air less deadly. The average PM2.5 (particles 2.5 micrometres or less in diameter) concentration in 2022 was 53.3 microgram per cubic metre in India. This is more than ten times the annual level of PM2.5 recommended by World Health Organisation’s 2021 air quality guidelines (5 microgram per cubic metre) and 1.3 times India’s own annual standard for PM2.5 of 40 microgram per cubic metre. China had a PM 2.5 concentration of 38.5 microgram per cubic metre.
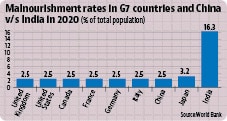
- India has a higher undernourishment rate in comparison to the G7 countries and China.The share of malnourished in India was 16.3% as opposed to 2.5% in most of the developed countries and China in 2020, according to World Bank data. Barring Japan, which has a malnourishment rate of 3.2%, all the G7 countries have just 2.5% of their population that is undernourished.
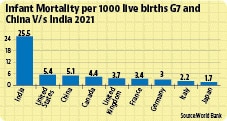
- India must also reduce its infant mortality rateIn India, 25 out of every 1000 children that were born, died before they turned one in 2021, according to World Bank data. The highest IMR among the G7 countries is in the US, which has an IMR of 5.4. In Japan, which has the lowest infant mortality rate, the number is just 1.7. China has also achieved an IMR reading close to that of the G-7 countries at 5.1. Undernourishment and infant mortality rates are linked and for India to catch up with the developed nations, policies need to focus on furthering social sector indicators.
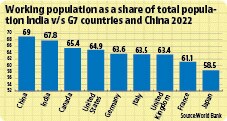
- But on the positive side India has the second largest share of working age populationThe proportion of the 15-64 age group, considered the working age population, was 67.8% in India last year, which gives it an advantage over the other G-7 countries, according to World Bank data. China has a larger share than all these countries, with 69% of its population in the age group. However, India’s 15-65 years population is projected to increase to more than China’s soon: in 2025 in absolute terms and in 2030 in percentage terms. To be sure, the G-7 countries are not very far behind with Canada and the United States having close to 65% of their population in working age currently. But India’s demographic advantage is likely to last well into the century.
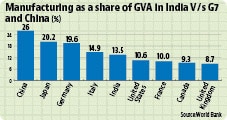
- India has to increase manufacturing as a share of GDPIndian manufacturing sector contributed only 13.5% to the nominal Gross Value Added, according to numbers from World Bank in 2019. This number is 20% in Japan and 26% in China. Countries such as the US and the UK have a much lower share of manufacturing in GVA, but this is a result of a transition to service sector after a long phase of industrialisation. India has not improved its share of manufacturing in GVA for a few decades. To become a developed economy, the Indian manufacturing sector needs to contribute more to the national output.