
 E-Paper



Data shows slight ‘dip’ in early-November pollution in Delhi
The November 1 to 15 stretch that has historically produced the Capital’s foulest air — has logged its lowest average air quality index (AQI) in three years.

 Prefer HTon Google


Delhi’s most toxic fortnight of the year — the November 1 to 15 stretch that has historically produced the Capital’s foulest air — has logged its lowest average air quality index (AQI) in three years. Yet the city has continued to breathe air that is overwhelmingly in the “very poor” to “severe” range. This year’s average of 349 is marginally lower than 367 in 2024 and 376 in 2023, and only a shade higher than 345 in 2022.
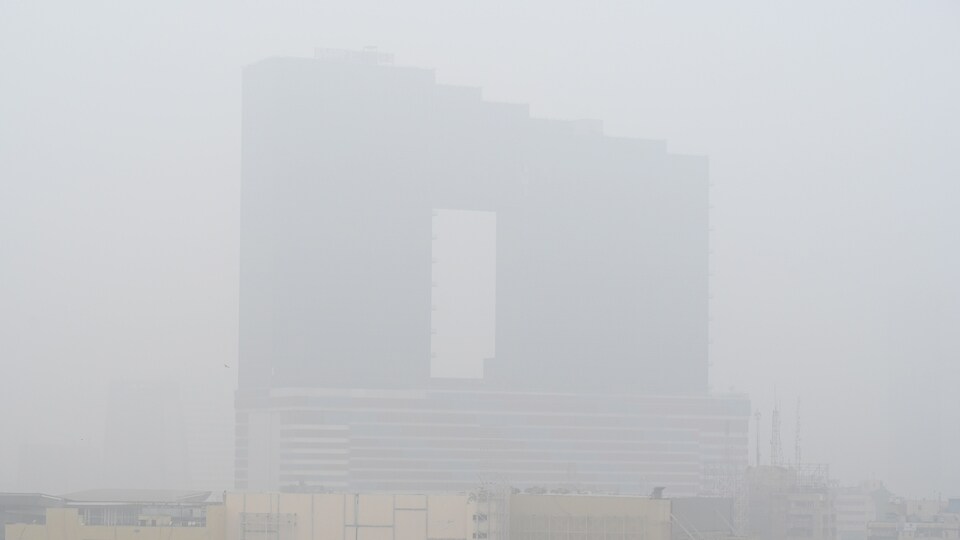
Experts, however, cautioned that this apparent dip should not be mistaken for cleaner air.
The lower numbers, they said, stem from a combination of meteorological luck, a delayed spike in stubble burning caused by flooding in Punjab, and a Diwali that arrived before the winter inversion set in. Further, data irregularities across the city’s monitoring network – including missing values and erratic readings – may be masking the true extent of pollution.
Also Read | Delhi air quality turns ‘severe’ as mercury dips to 9.7 degrees Celsius
Between 2018 and 2023, the Delhi Pollution Control Committee (DPCC) has consistently identified this two-week window as the city’s dirtiest period of the year, with an average AQI of 371. Its position at the intersection of peak farm fires, Diwali fireworks and the arrival of cold, stagnant winter air typically creates a toxic lockstep. This year, however, Diwali fell unusually early, on October 20, when minimum temperatures had not yet dipped enough for pollutant-trapping inversion layers to harden over the city.
At the same time, crop residue burning has remained well below the levels seen in recent years – largely because flooding in Punjab delayed harvest cycles and, consequently, the burning season. Punjab recorded 4,877 farm fires between November 1 and 15, down sharply from 7,864 in the same period last year, according to data from the Indian Agricultural Research Institute (IARI). In Haryana, the count fell to 516, compared to 1,055 last year.
Also Read | Delhi expands pollution hot spots to 62 as ministers launch field inspections
The Decision Support System (DSS), which tracks the share of stubble burning in Delhi’s pollution mix, reported a peak contribution of 22.47% this November – significantly lower than the peaks of around 35% recorded in the same time period in 2020, 2022 and 2023, and far below the 48% peak of 2021. Curiously, DSS carried no data for November 15 and 16, mirroring a pattern of intermittent gaps that experts said complicate the already clouded assessment.
That fragility was underscored earlier this month when HT found missing data, suspiciously static readings and algorithmic gaps across the city’s 39 active monitoring stations – discrepancies that can nudge Delhi’s official daily AQI up or down. On November 10, for instance, when most stations registered “severe” pollution, the NSIT Dwarka monitor reported “moderate” PM2.5 levels through the day, oscillating between a sub-index of 70 and 350 in a pattern experts deemed highly improbable.
Sunil Dahiya, founder of the think tank EnviroCatalysts, said the city’s marginally better numbers “should be viewed cautiously.”
“The values still point to a severely polluted environment, but the trust in these numbers is lower this year,” he said, pointing to instances of water sprinkling and physical obstructions around several monitoring stations. He added that the delayed spike in stubble burning – with higher fire counts coming later than usual may have also pulled the average down for the first half of November.
CPCB data for this fortnight shows three “severe” days, 10 “very poor” days and two “poor” days. Last year, Delhi saw two severe days and 13 very poor days in the same period.
Meteorology has offered temporary relief as well. “Higher wind speeds helped disperse emissions during the first half of November,” said Dipankar Saha, former head of the Central Pollution Control Board’s air laboratory. “If winds pick up again, we can expect more very poor or even poor days instead of severe.”
Those winds may not hold. The Air Quality Early Warning System (EWS) under the Union earth sciences ministry has forecast a return to “severe” conditions from Monday through Wednesday, with the city expected to oscillate between severe and very poor for at least six days. Delhi’s AQI was 377 (“very poor”) at 4pm on Sunday.
Beyond November, the city typically slides into its second-worst pollution stretch between December 15 and 31, when dense fog and a surge in wedding-season traffic push the average AQI to 354. The January 1 to 15 period follows with an average AQI of 324.


Stay updated with all top Cities including, Bengaluru, Delhi, Mumbai and more across India. Stay informed on the latest happenings in World News along with Delhi Election 2025 and Delhi Election Result 2025 Live, New Delhi Election Result Live, Kalkaji Election Result Live at Hindustan Times.


