E-Paper



Demographic debates need sanity, not crude rhetoric | Number Theory
This two-part data journalism series seeks to throw official numbers at the always simmering pot of demographic debates in India

 Prefer HTon Google


The public discourse around demographics in India is usually divisive. Sometimes it is about the population as a whole, at other times, its religious composition, and still other times, the north-versus-south debate. The overall demographic paranoia is perhaps a ghost of the early years of independence, when population growth far outpaced the growth in economic resources, including food. These pages have argued in detail why India needs to get over its demographic paranoia and instead focus on exploiting its demographic dividend. Debates about the North versus the South are rooted in distributional concerns, both fiscal and political; and the faith debate is overwhelmingly political dog-whistling.
This two-part data journalism series seeks to throw official numbers at the always simmering pot of demographic debates in India and separate fact from (convenient) fiction. The first part will look at demographic trends by state and district and the second part will look at the issues around India’s religious demographics.
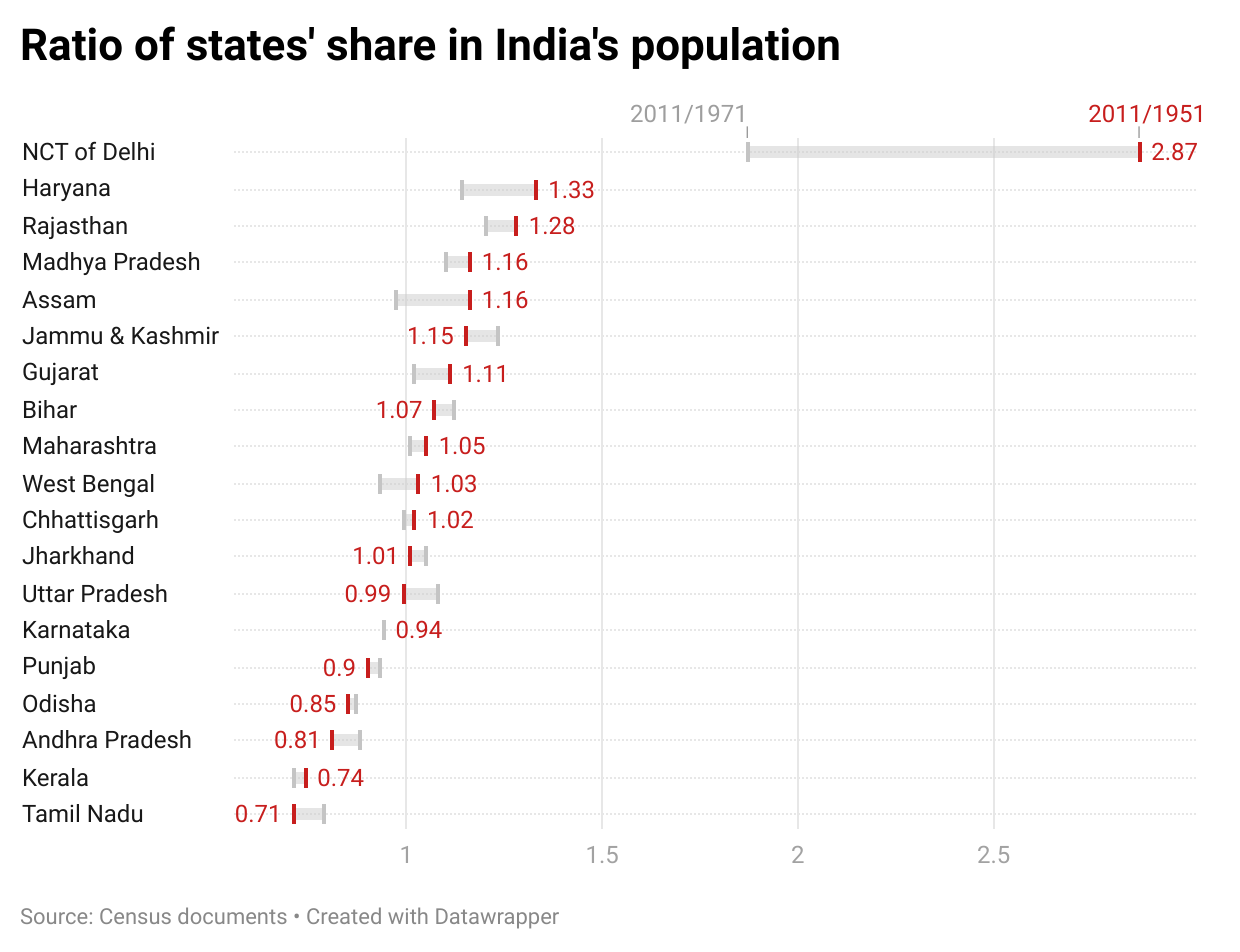
 States have seen divergent changes in their national population sharesA comparison of the share of provinces in population from 1951 to 2011 shows a large divergence . Delhi’s share in national population, for example, has increased 2.87 times, the highest among states and UTs with at least 1% population share in the 2011 census. However, it reached a 1% share in India’s population only in 2011. The states and UTs ranked after Delhi in terms of growth in national population share during this period are Haryana, Rajasthan, Madhya Pradesh, and Assam. But their share has increased by a multiple of just 1.33 to 1.16. On the other hand, states such as Kerala and Tamil Nadu have seen their shares fall to 0.75 and 0.71 times that in 1951. To be sure, it is worthwhile to look at change in state-wise population shares somewhat more recently. While 1981 would have been ideal, as it is the middle point between 1951 and 2011, lack of a census in Assam in 1981 makes it difficult. A comparison from 1971 to 2011 shows that the increase in population share of states like Bihar, Uttar Pradesh, and Jammu and Kashmir is faster in the 1971-2011 period compared to the 1951-2011 period, while that of Delhi is slower. Assam’s population share, on the other hand, has declined in the 1971-2011 period, compared to a growth in the 1951-2011 period.
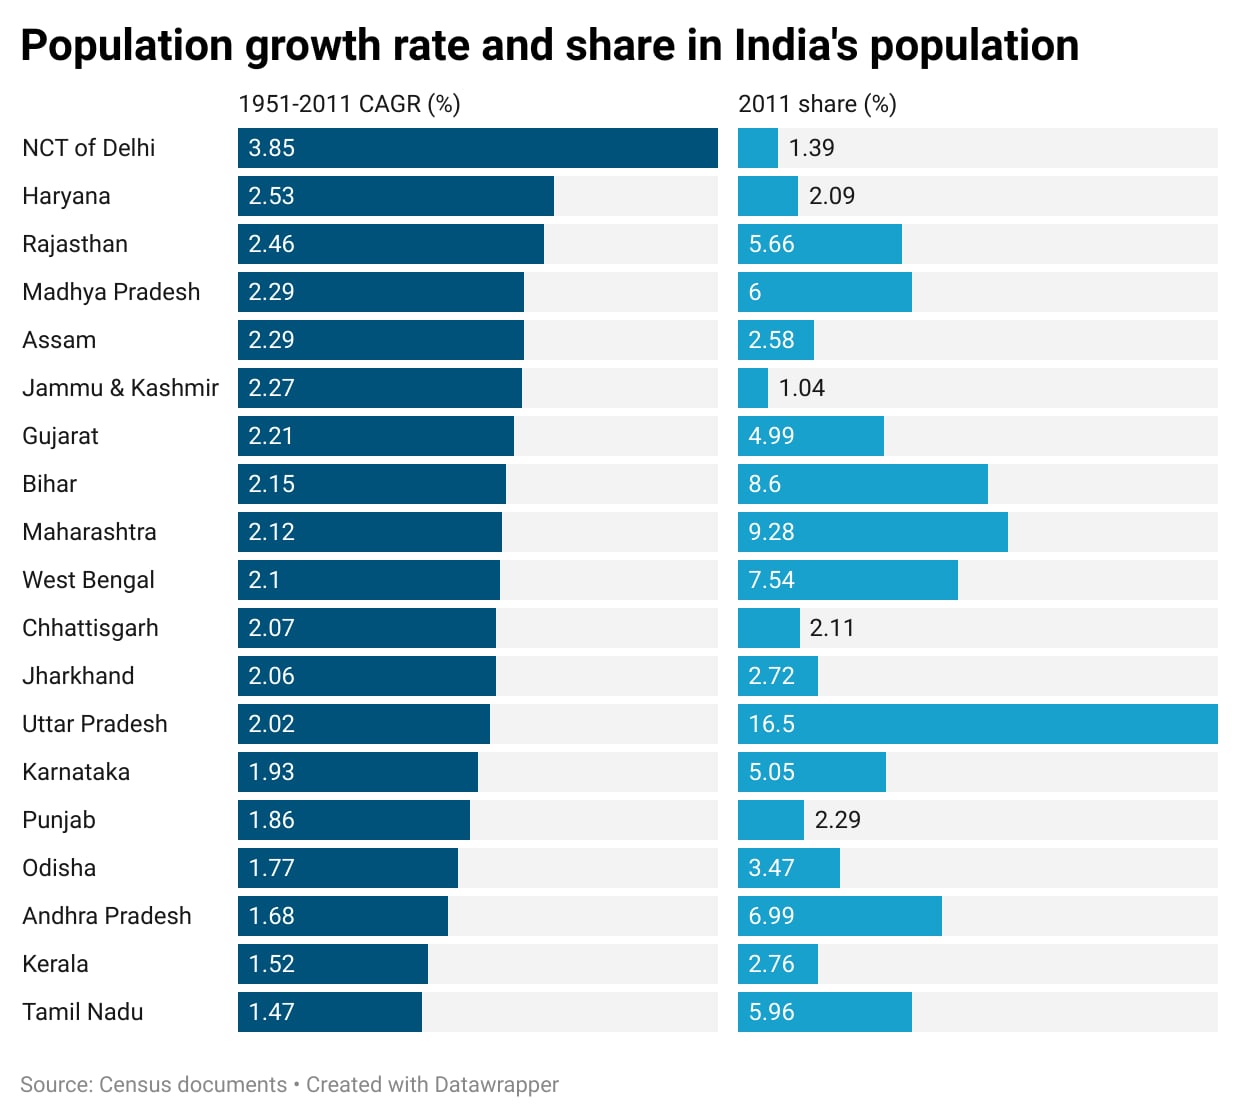
- But the highest growth states are not necessarily the most populousThis might sound counter-intuitive, but this is a necessary condition for a region’s survival. If the most populous state of India at any time also grew at the fastest rate in the country, it would come under immense economic and environmental strain. This does not mean that India’s most populous states in 2011 – Uttar Pradesh, Maharashtra, Bihar, West Bengal, and Andhra Pradesh – have grown at a slow rate. It is just that they are behind the fastest growing among big states/UTs, which were Delhi, Haryana, Rajasthan, Madhya Pradesh, and Assam in the 1951-2011 period. Another way to make sense of this counter-intuitive trend is that while states such as Bihar and Uttar Pradesh have high fertility and birth rates among big states in 2011, they also figure among the top in death rates, and also have high rates of migration to other states. It is the combination of these three factors that determines the growth rate of the population. Yet another reason why the top five populous states were ranked so in 2011 is simply that all of them were among the top five even in 1951, except West Bengal, which was ranked sixth. This is unlikely to settle the north-versus-south debate on population growth because the peninsular states are at the bottom of the table of population growth even if the most populous states are not at the top. This was not always the case. Kerala and Karnataka’s population growth was faster than Bihar and Uttar Pradesh in the 1951-1971 period, and has slowed since
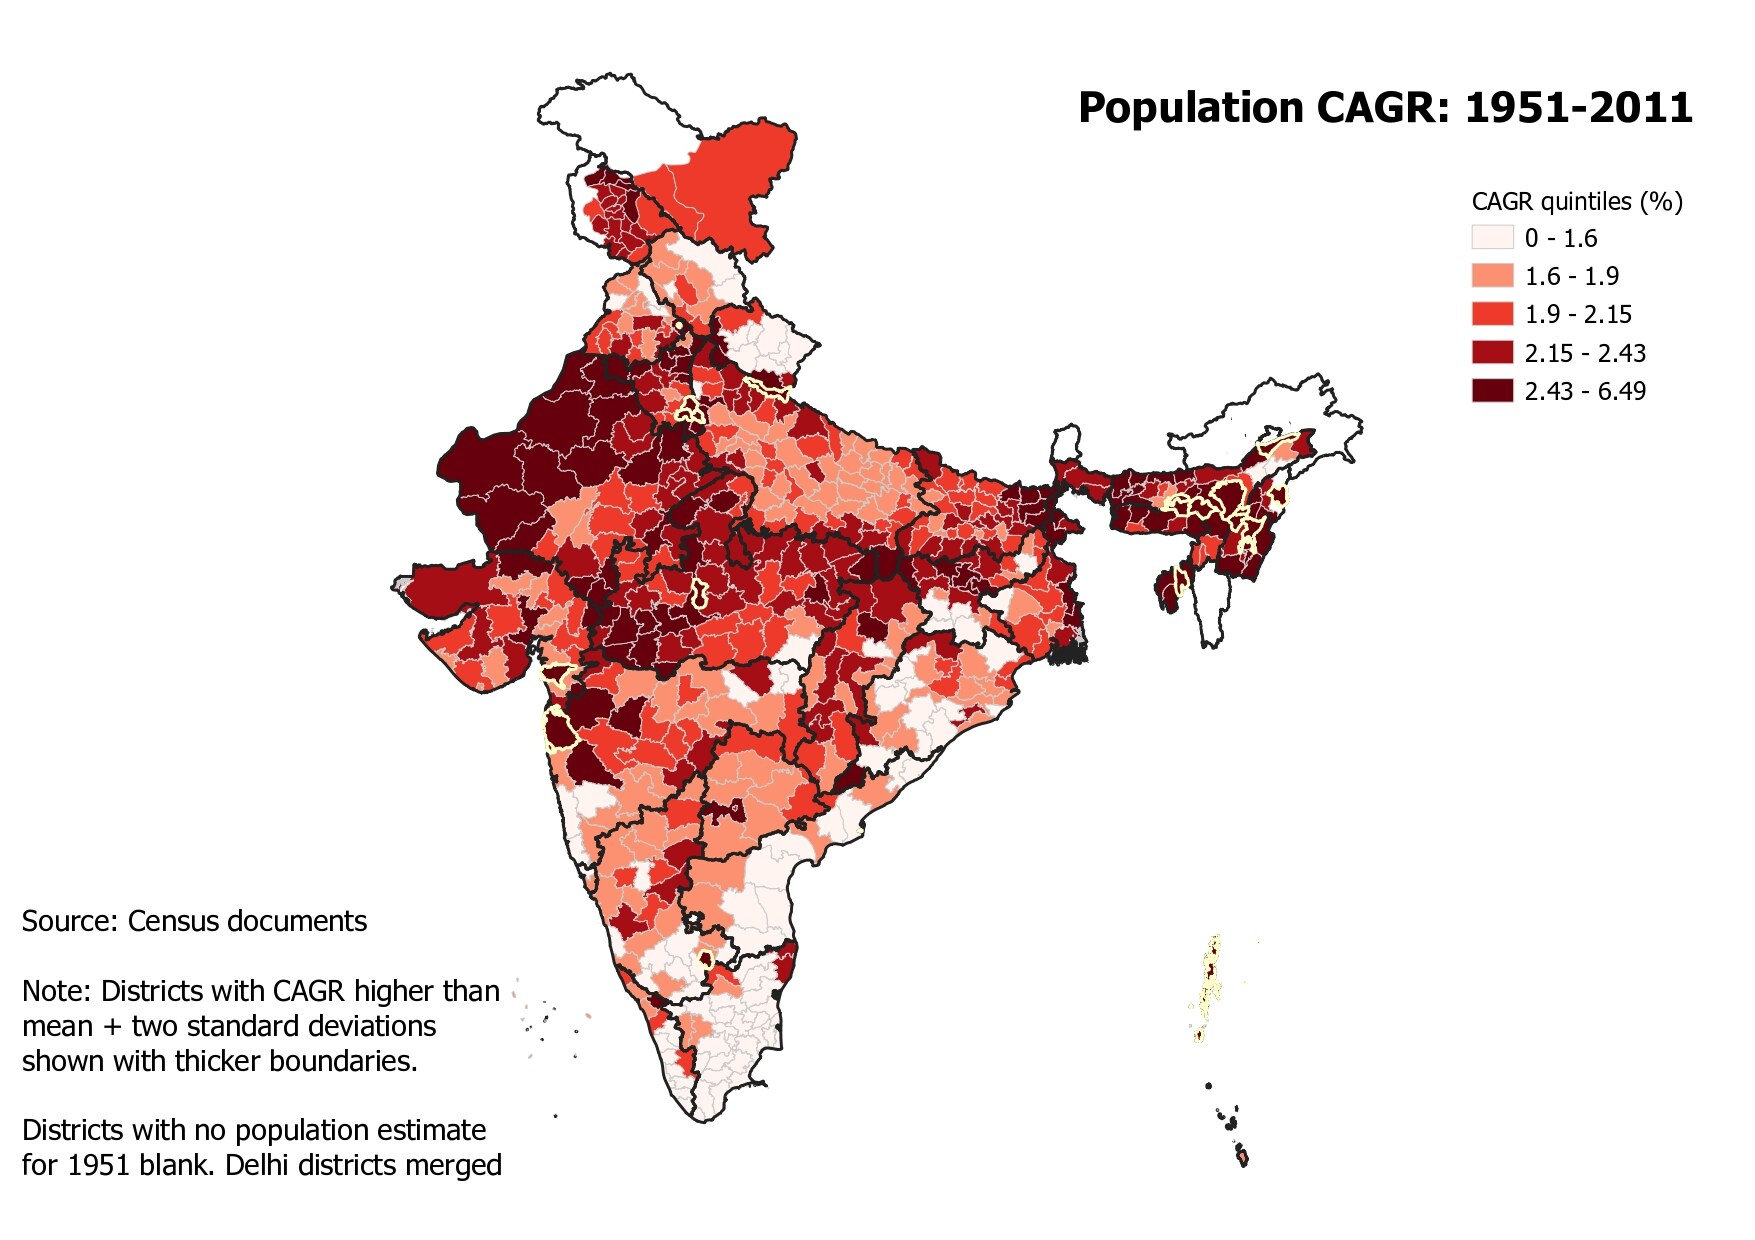
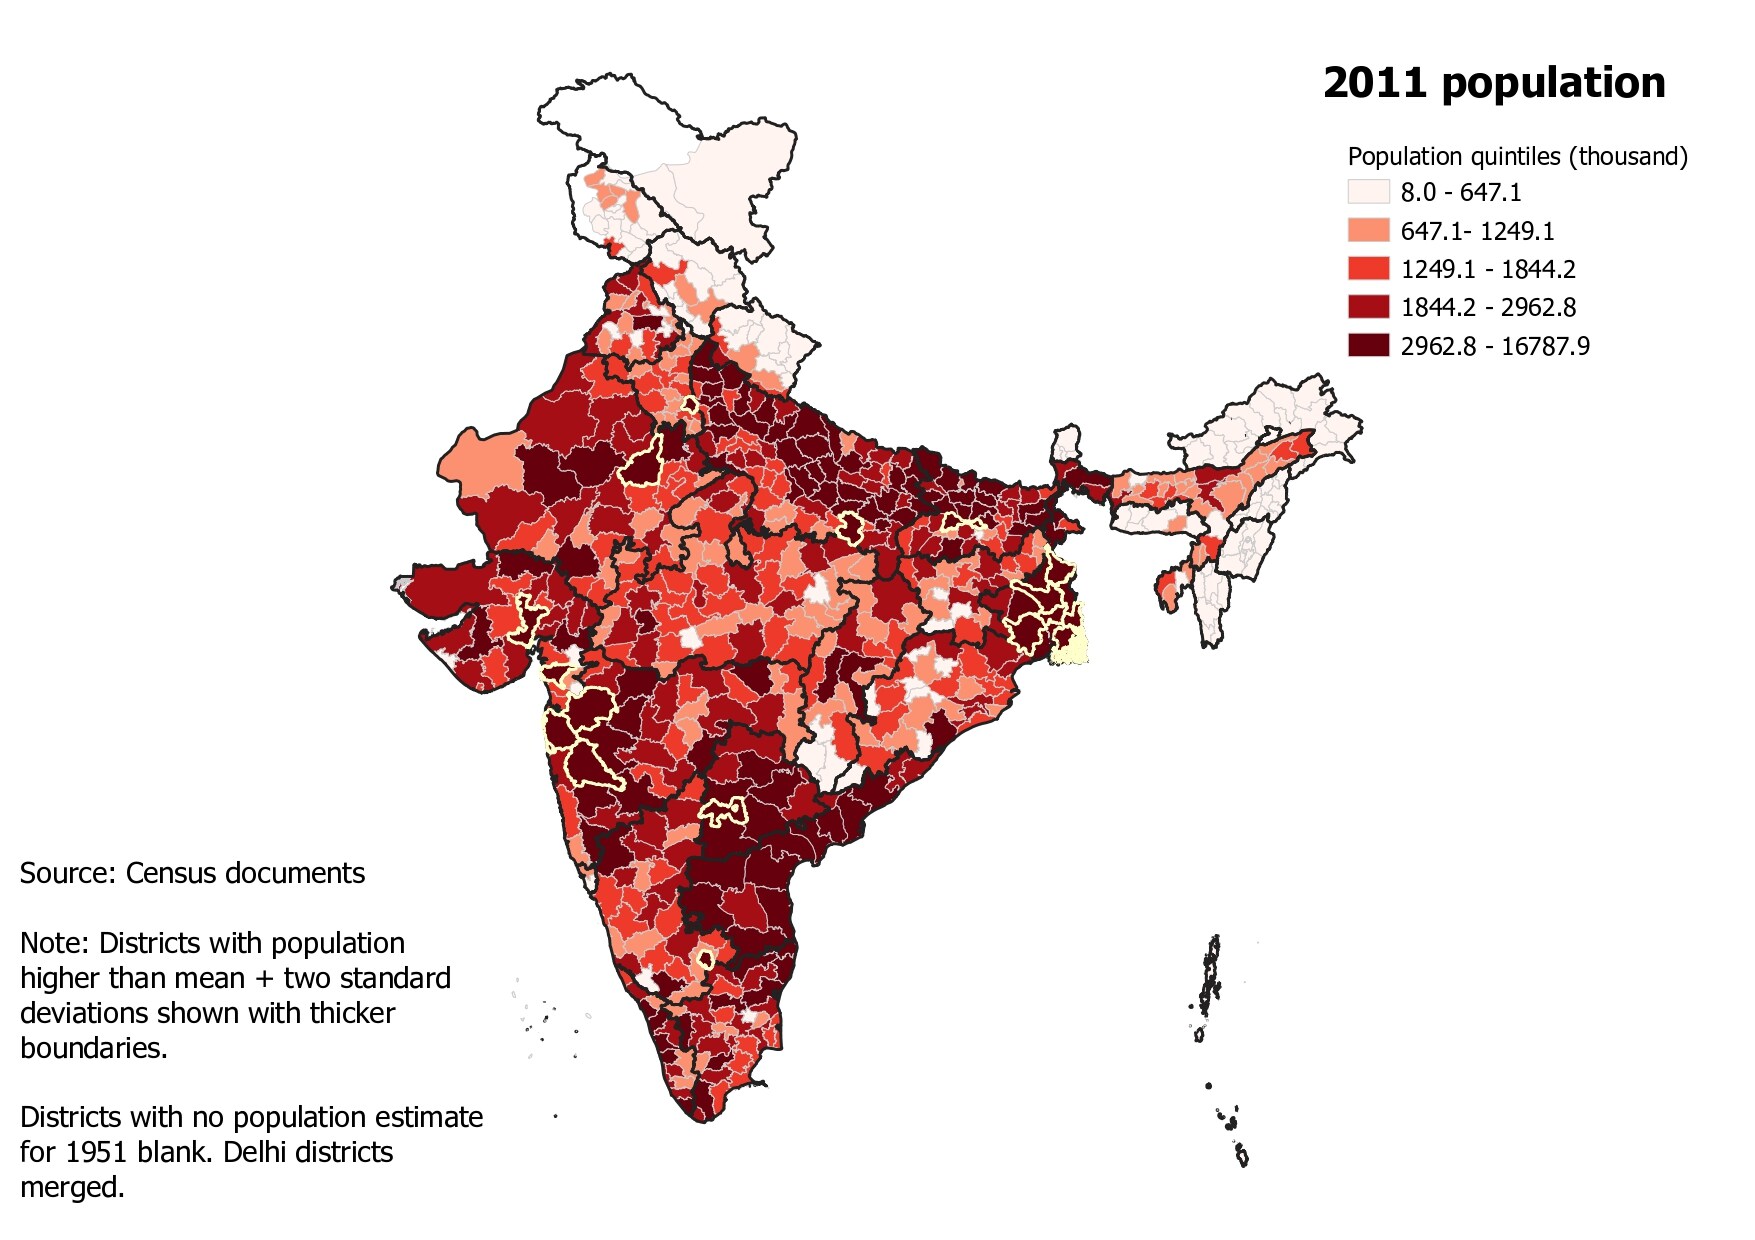
- Relation between growth rate and current population is weak even at the district levelUsing the back series population data at the district level provided on the Census website, it is also possible to check population growth at the district level from 1951 to 2011. The census website has given this data for 601 out of the 640 districts in 2011. The districts for which this data is not available are in Nagaland, Arunachal Pradesh, Sikkim, and Mizoram, where this series does not exist for 1951. All of Delhi has been taken as one district here. The median compound annual growth rate (CAGR) of population in these 601 districts between 1951 and 2011 is 2.1%. As is to be expected, most of the high CAGR districts are located in the northern part of the country. However, the districts with the highest growth in population were not the most populous in 2011.