
 E-Paper



Is the United States in a fiscal talespin | Number Theory
How bad is the US fiscal trajectory? What does the future outlook look like? Here are four charts which answer this question
Updated on: May 22, 2025, 08:34:03 IST

 Prefer HTon Google
Share via


Copy link

Days after Moody’s downgraded its credit rating for US from AAA to AA1, the International Monetary Fund (IMF) has flagged what it sees as the “ever increasing” debt burden of the world’s largest economy. “The US fiscal deficits are too large and they need to be brought down,” Gita Gopinath, IMF’s first deputy managing director, told the Financial Times. While IMF has been known for making critical observations about the fiscal health of smaller economies, especially those outside the advanced economy realm, its remarks about fiscal health of the US are clearly out of the ordinary. How bad is the US fiscal trajectory? What does the future outlook look like? Here are four charts which answer this question.

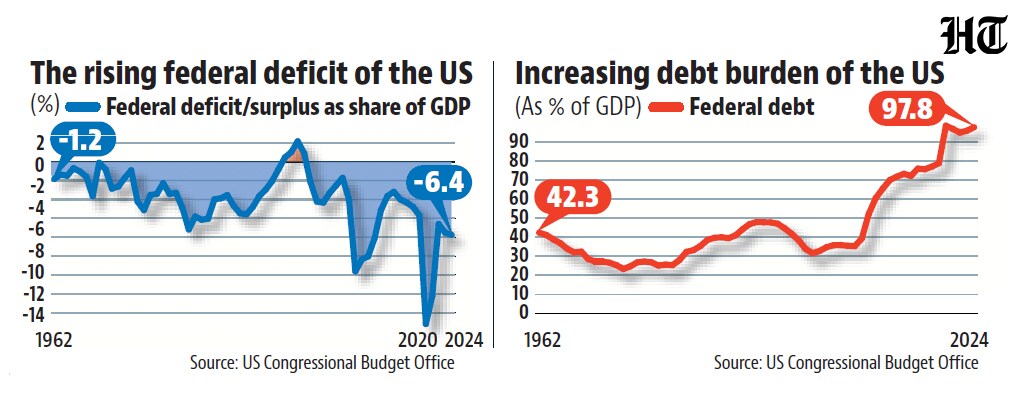
 US fiscal deficit has come down post-pandemic but debt hasn’tUS had a fiscal deficit of 6.4% and debt-GDP ratio of 97.8% in 2024. The fiscal deficit number has come down significantly from the pandemic’s high of 14.7% in 2020 but is still very high compared to historical levels. The debt-GDP ratio, however, has proved to be stickier and is even higher by historical standards. See Chart 1: US fiscal deficit and debt-GDP ratio from 1960 to 2024
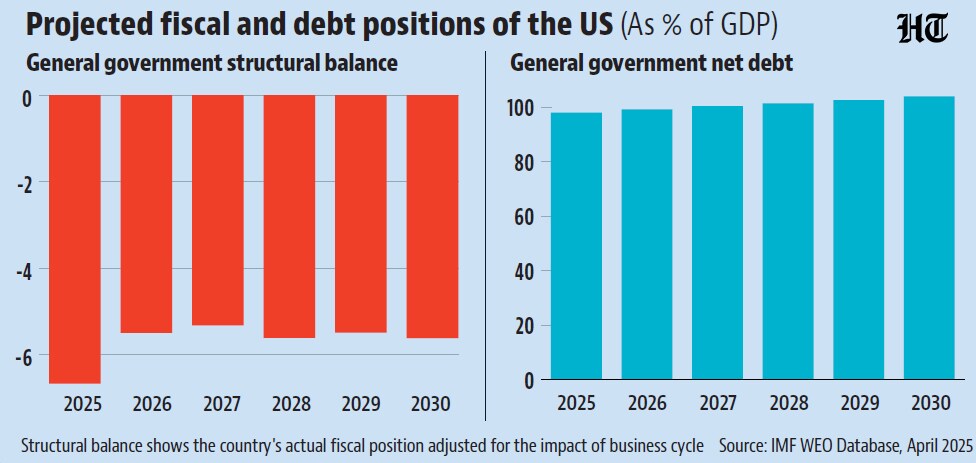
- Almost everybody believes that the numbers are not going to improve anytime soonFederal debt held by public will reach 118.48% of GDP by 2035, and deficit will reach 6.1%, according to the non-partisan Congressional Budget Office’s March 2025 estimates. April projections by the IMF’s World Economic Outlook see US’s debt-GDP ratio rising to 128% by 2030, while its structural balance – actual fiscal position adjusted for the impact of business cycle – is expected to improve marginally. Moody’s while cutting its US ratings said that it expected US’s fiscal deficit and debt-GDP ratio to be 9% and 134% by 2035. See Chart 2: US projected fiscal deficit and debt-GDP ratio from IMF-WEO
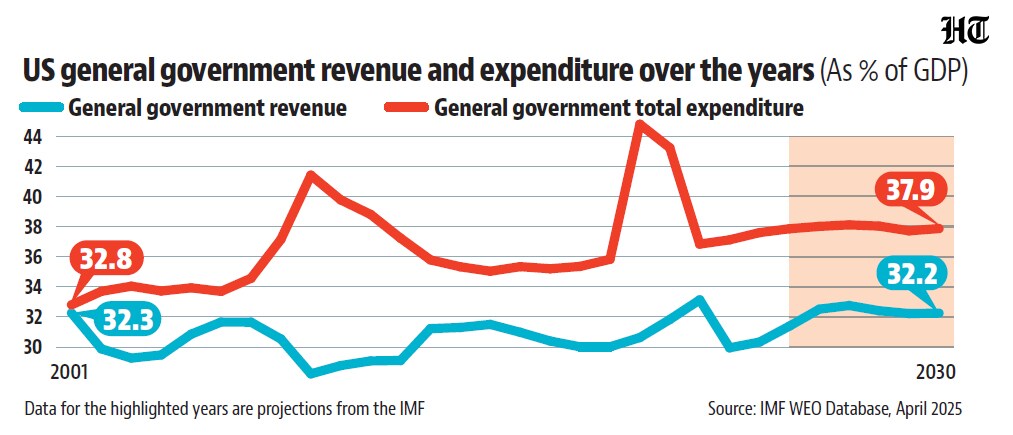
- At the heart of the fiscal problem is a gap between taxes and spendingWEO data from IMF shows this clearly. General government spending as a share of GDP was 32.8% in 2001, the earliest period for which data is available in the WEO database. This was almost the same as the general government ratio as a share of GDP in that period. While the tax-GDP ratio has fallen marginally by 2024, government spending has grown creating a fiscal gap . Trump’s 2017 tax cuts, which he now wants to extend, have only added to the problem. IMF projections do not see the gap between government revenue and spending closing until 2030. “The non-partisan Committee for a Responsible Federal Budget estimates the bill will increase US national debt by more than $3.3tn over the next decade. Investors have expressed concern over the sustainability of the country’s public finances and whether the world will continue to finance the government in Washington”, the Financial Times reported on Wednesday. See Chart 3: US general government revenue and spending as share of GDP
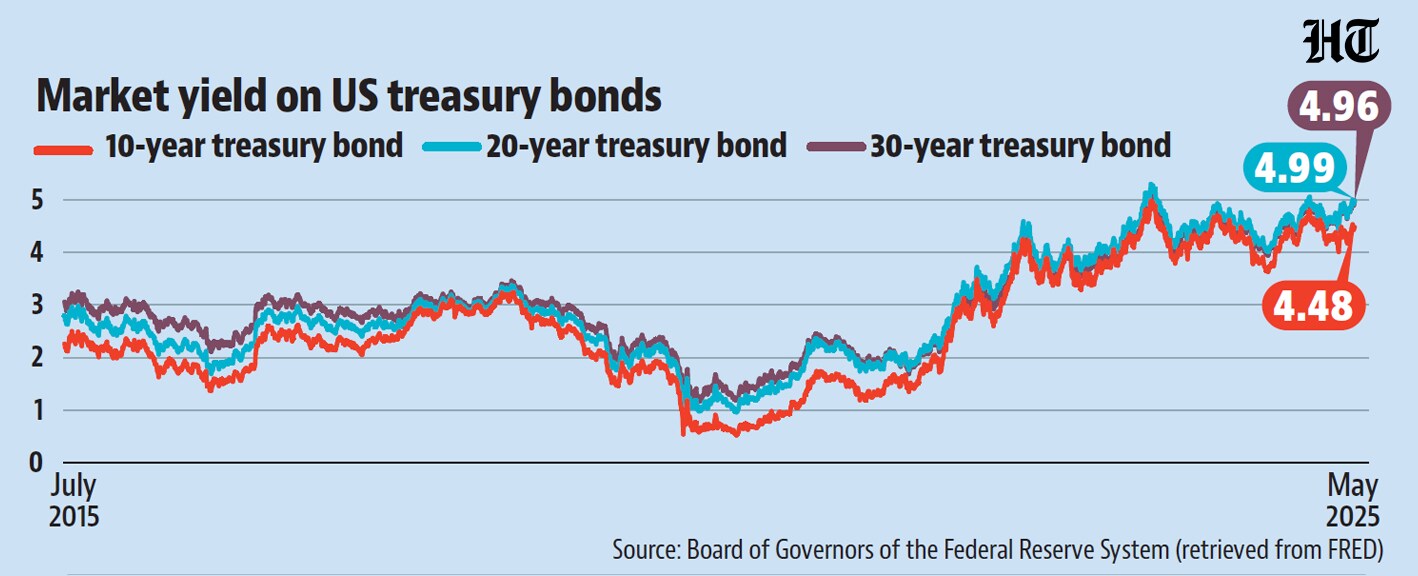
- Rising debt-servicing costs could worsen US’s fiscal problemWhile the Trump administration maintains that its tax cuts, deregulation, and spending curbs will generate enough economic growth to cover their costs, markets aren’t buying it. Moody’s and bond investors remain unconvinced, with deficit concerns and the downgrade dragging down the dollar and driving Treasury prices lower and yields higher. Since 2021, the sharp rise in Treasury yields has already made debt more expensive to service. With deficits widening and borrowing costs climbing, the government now faces the prospect of taking on more debt just as it becomes costlier to do so. Estimates show that interest payments could consume nearly 30% of federal revenue by 2035—up from 18% in 2024 and just 9% in 2021. See Chart 4: Bond yields



Unlock a world of Benefits with HT! From insightful newsletters to real-time news alerts and a personalized news feed – it's all here, just a click away! -Login Now!


