E-Paper



Number Theory: Taking stock of the second phase contest
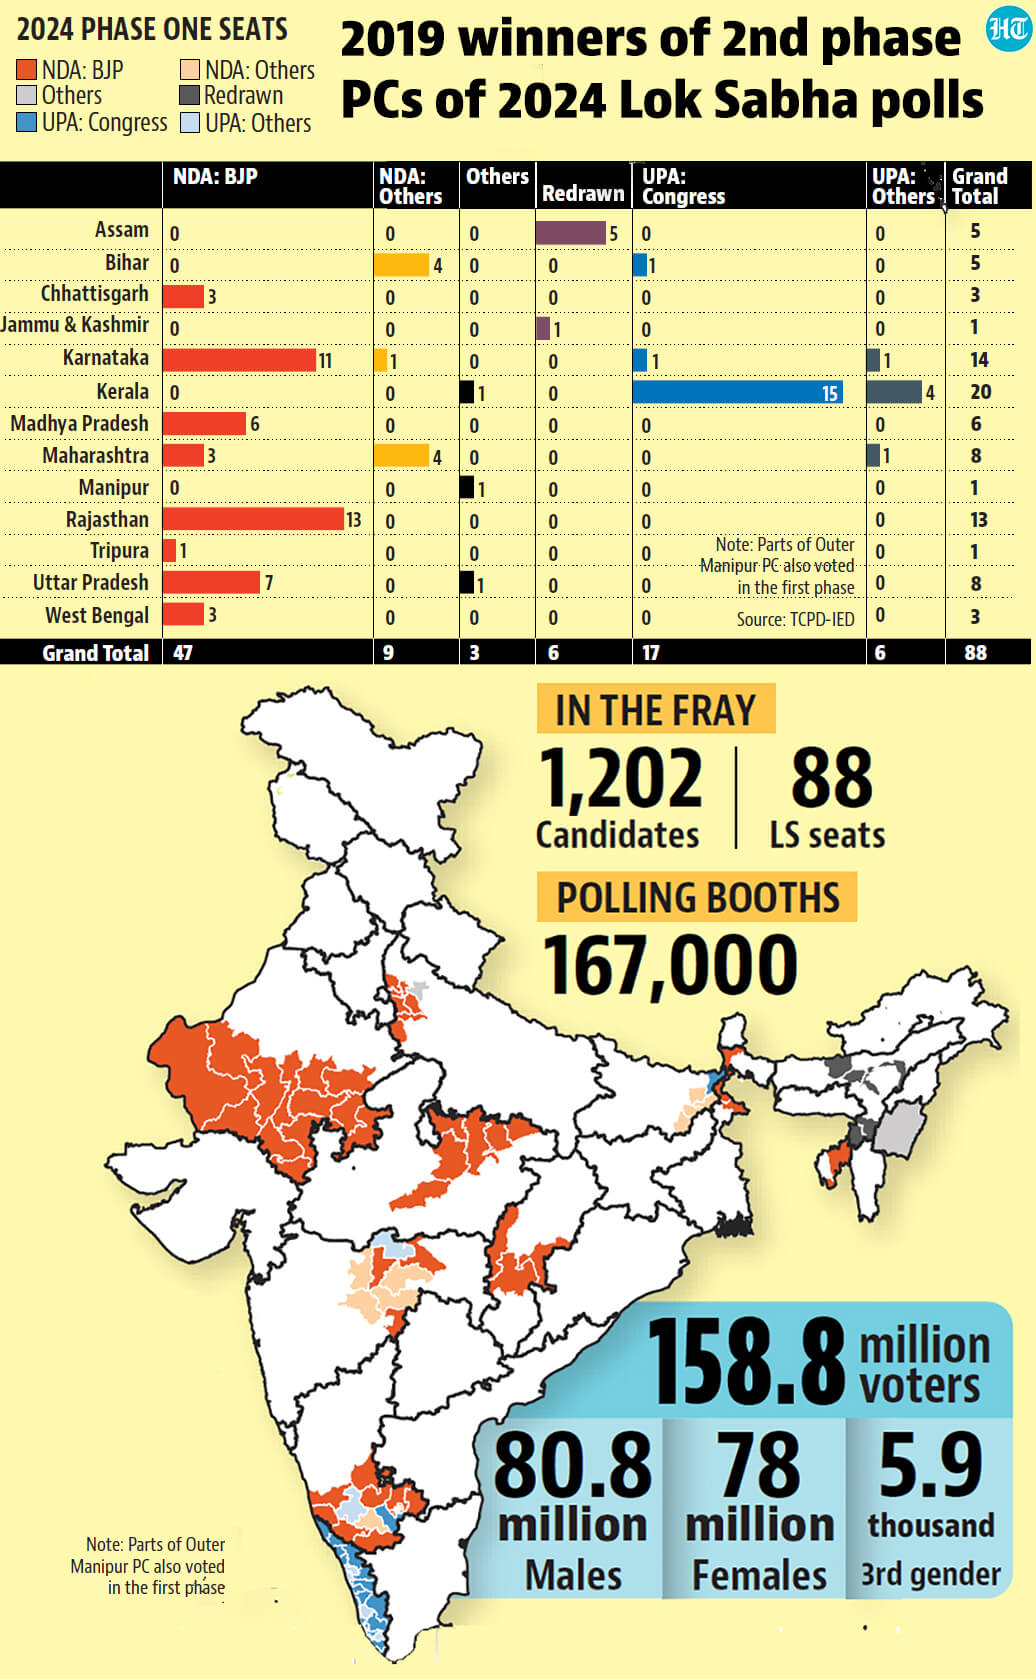
A total of 88 parliamentary constituencies (PCs) across 12 states and the UT of Jammu and Kashmir will vote in Phase 2 of the 2024 Lok Sabha elections today.
Published on: Apr 26, 2024, 07:47:08 IST

 Prefer HTon Google
Share via


Copy link

After this phase, the fourth largest among the seven, voting would have concluded in 189 of India’s total 543 PCs and 14 of 36 states and UTs overall. The following four charts explain the nature of the contest in this phase.
Taking stock of the second phase contest
 The best phase for the Congress, but it does not mean it's a bad phase for the BJP15 of the Congress’s 52 wins in the 2019 Lok Sabha elections came from Kerala. Since all 20 PCs in Kerala are voting today, it is no surprise that the party’s 2019 performance was the best in the second phase PCs of 2024. However, it won just 17 of the 82 PCs for which 2019 results are comparable. The remaining six PCs are in Assam and Jammu and Kashmir, whose boundaries were redrawn in a delimitation exercise after the 2019 Lok Sabha elections. They have been excluded from this analysis. Among the 82 PCs, the only two seats outside Kerala that the Congress won are the only PCs it won in Karnataka and Bihar in that election: Bangalore Rural and Kishanganj. As these numbers suggest, it is a good phase for the Congress only in relative terms. This broad trend also holds true for Congress and its allies taken together. To be sure, while this might be the strongest phase for the Congress (second-strongest for Congress and allies taken together), it is only the fourth weakest phase for the Bharatiya Janata Party (BJP) relative to other phases. In absolute terms, the BJP was not a weak party in these PCs in 2019 at all. It won 47 of the 82 PCs. BJP’s allies won another nine seats. However, at least in Maharashtra, the past victories of both the BJP and the Congress allies need to be ready with caution. This is because both the Shiv Sena (BJP’s ally) and the Nationalist Congress Party (NCP, which was a Congress ally in 2019) have undergone a split since the 2019 Lok Sabha elections, with constituents now on either side of the electoral battle.
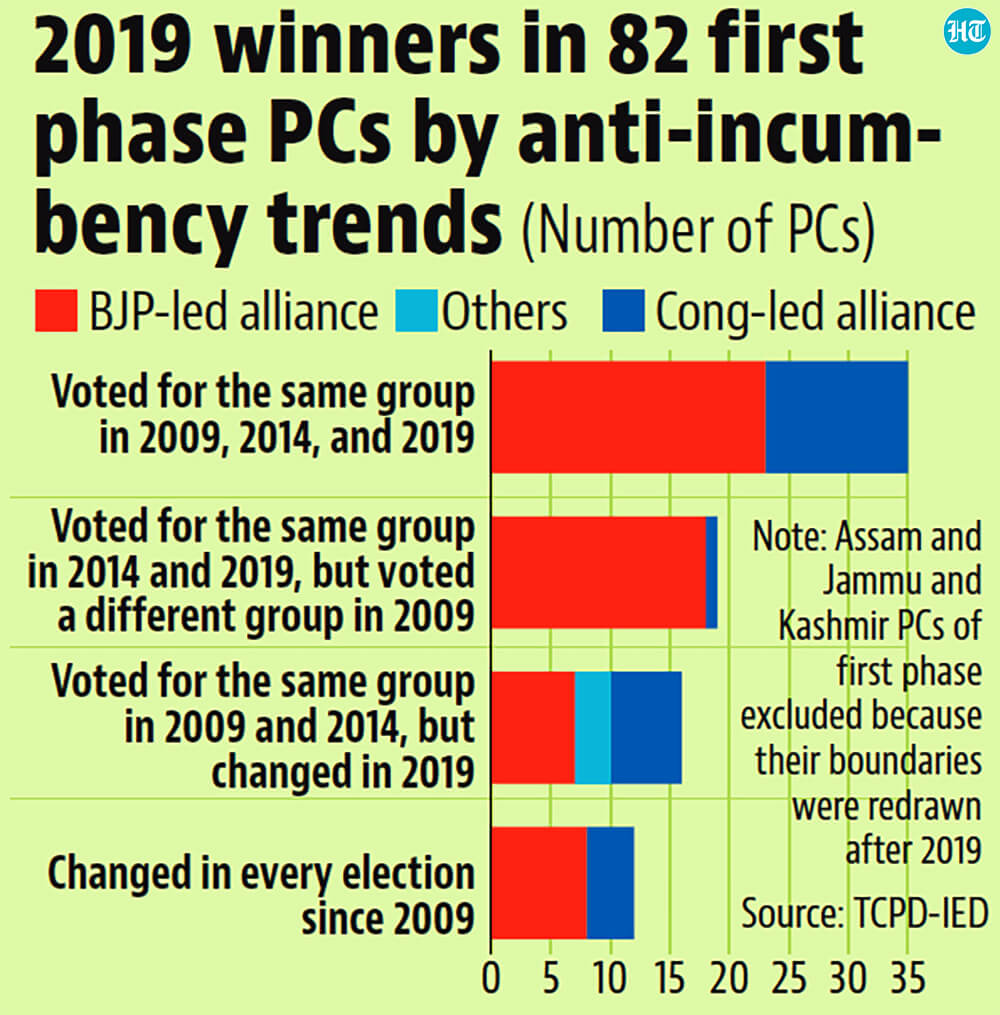
- What are the anti-incumbency trends in these seats?35 of the 82 PCs have been consistently won by either a BJP-led alliance (23 PCs) or a Congress-led alliance (12 PCs) since 2009, the earliest Lok Sabha election up to which these PCs can be tracked. This means that the winning group has not changed in over 40% of the PCs voting today since 2009 if parties are grouped as a BJP-led alliance, a Congress-led alliance and others. Apart from these 35 PCs, 16 PCs were won by the same alliance in 2009 and 2014, but not in 2019. The BJP-led alliance won seven of them in 2019, the Congress-led alliance six, and others the remaining three PCs. Similarly, 19 PCs were won by the same group in 2014 and 2019, but not in 2009. Of these 19, a BJP-led group won 18 in 2019 and a Congress alliance, one. Only 12 PCs have been won by a different group in each subsequent election. A BJP-led group won eight of them in 2019 and a Congress-led group won the other four.
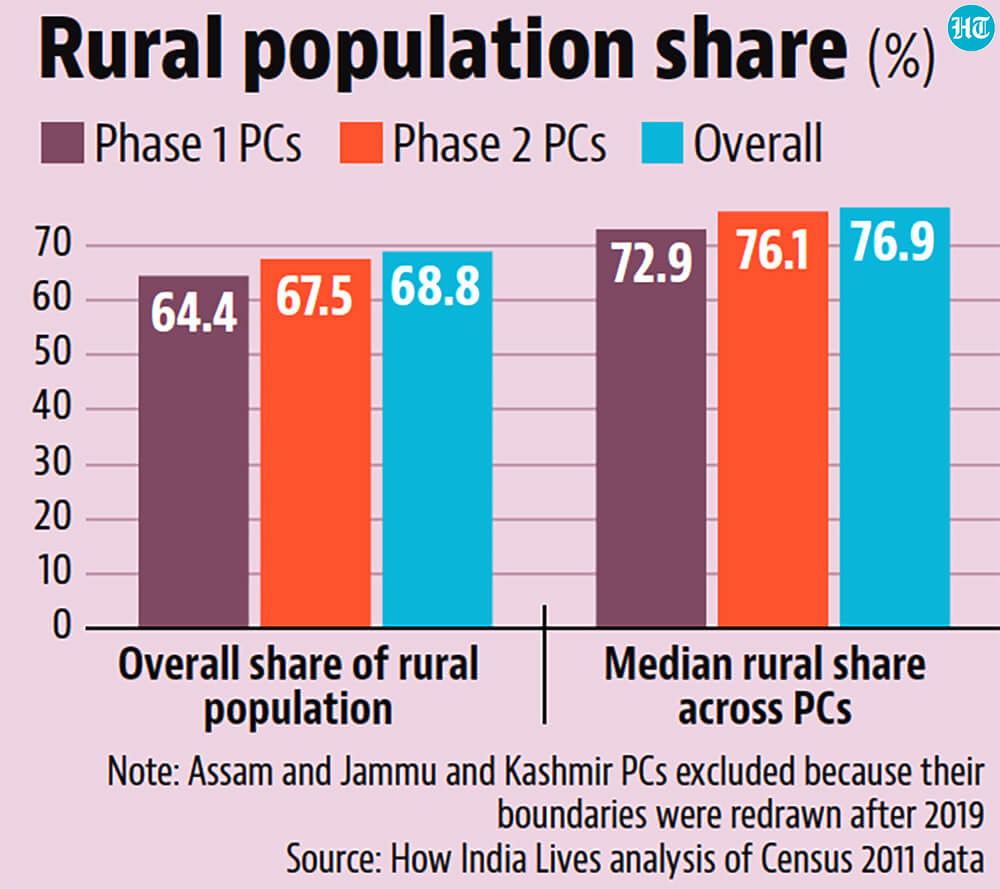
- This phase is only marginally more urban than the average Indian PCHow India Lives has calculated the rural share of population in PCs by mapping the 2011 census data to PCs as far as possible. While the census data is now over a decade old because the government has delayed the 2021 census, it is still one of the better ways to classify PCs as relatively more urban or rural. Satellite data can end up classifying even under-developed Bihar PCs as urban just because they are densely populated. The 2011 census data shows that the second phase PCs on average are like the average Indian PC as far as their rural composition is concerned. The average share of rural population in these 82 PCs was around 67.5%, compared to the India average of 68.8%. To be sure, this average is low because some big urban centres and regions – such as the Bangalore PCs in Karnataka and most PCs in Kerala – are also voting today. The median (middle value) of rural population across the second phase PCs was 76.1%, compared to 76.9% for all PCs taken together.
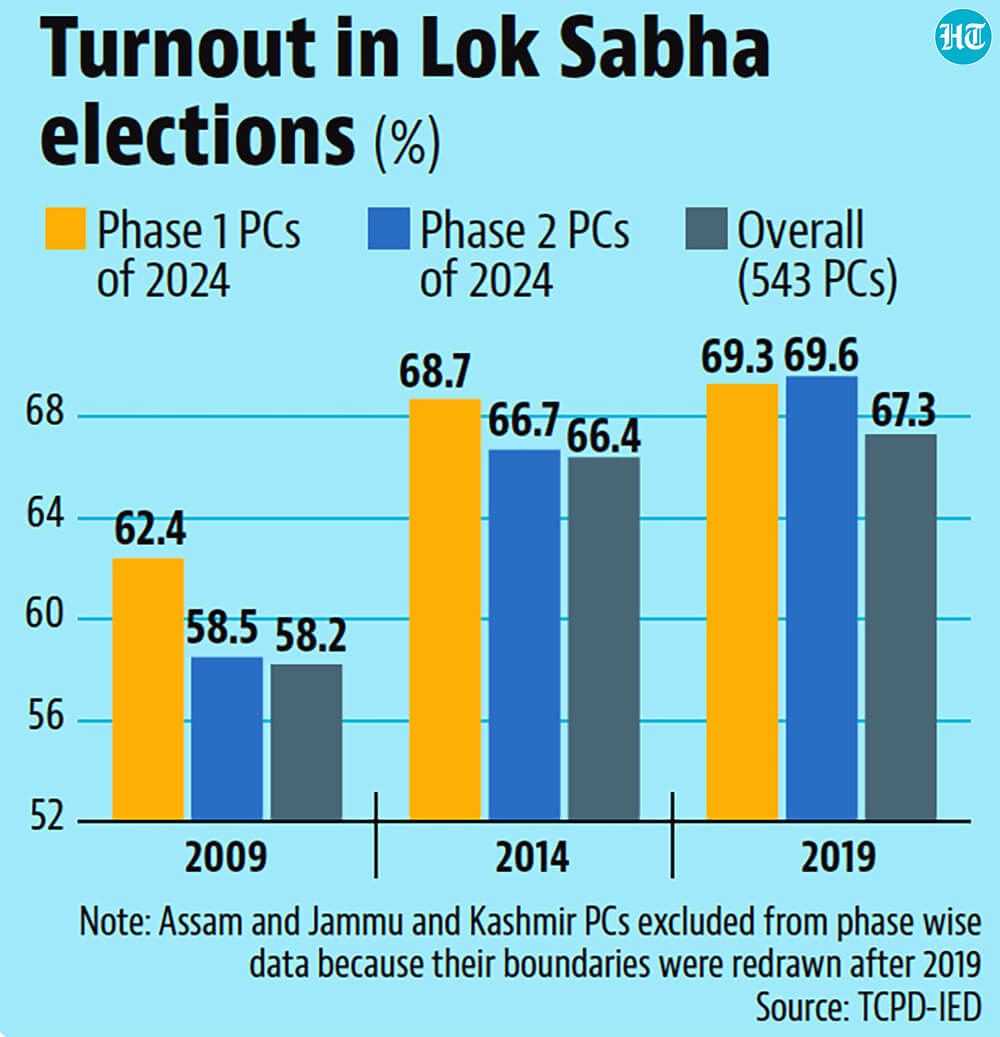
- These seats usually see higher turnout and higher growth in turnout compared to the average PCThe overall turnout in the PCs voting today has always been higher than the national average since 2009. Moreover, they have also shown higher proportional growth in turnout since 2009 compared to the national average. This can be seen at the PC-level: 39 of these 82 PCs saw higher turnout than the national average in 2009. This number increased to 44 PCs in 2014 and 50 PCs in 2019. Given the preliminary trend of lower turnout in the first phase in the ongoing elections, it will be interesting to see if the trend of relatively higher turnout in second phase PCs continues.